Type text, add images, blackout confidential details, add comments, highlights and more.
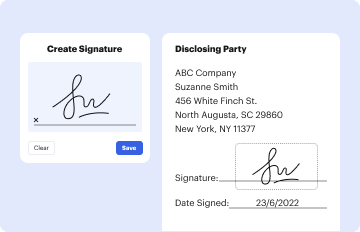
02. Sign it in a few clicks
Draw your signature, type it, upload its image, or use your mobile device as a signature pad.
03. Share your form with others
Send it via email, link, or fax. You can also download it, export it or print it out.
How to use or fill out City Where Crash Occurred: with our platform
Ease of Setup
DocHub User Ratings on G2
Ease of Use
DocHub User Ratings on G2
Click ‘Get Form’ to open it in the editor.
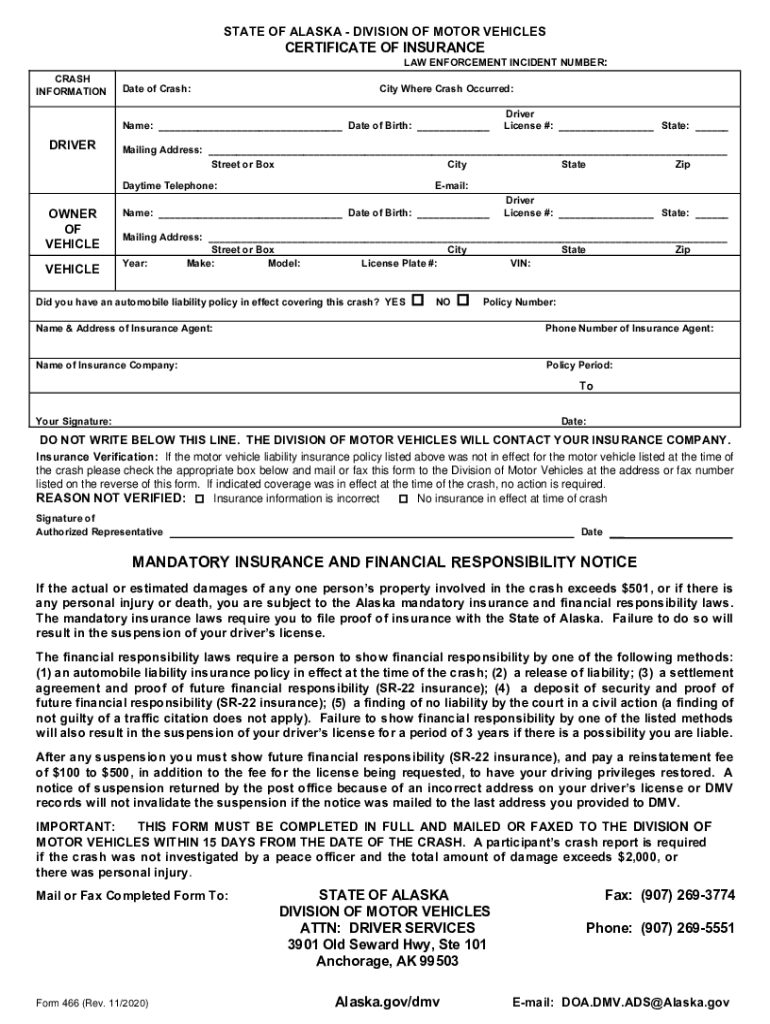
Begin by entering the 'City Where Crash Occurred:' in the designated field. Ensure that you input the correct city name as this is crucial for accurate reporting.
Next, fill in the 'Date of Crash:' field using the required format (Month/Day/Year). For example, enter '11/4/11' for November 4, 2011.
Proceed to complete the driver and vehicle sections. Input your name, date of birth, mailing address, and daytime telephone number accurately.
For vehicle details, provide information such as year, make, model, license plate number, and VIN. This ensures all necessary data is captured.
Indicate whether you had an automobile liability policy in effect at the time of the crash by selecting 'YES' or 'NO.' If applicable, include your policy number and insurance agent's contact information.
Finally, review all entries for accuracy before signing your form after printing. Make sure to submit it within 15 days from the date of the crash.
Start filling out your form online for free today!
Fill out City Where Crash Occurred: online It's free
We've got more versions of the City Where Crash Occurred: form. Select the right City Where Crash Occurred: version from the list and start editing it straight away!
In 2022, there were 42,795 motor vehicle fatalities. In 2023, the NHTSA reported 40,990 deaths, a 4.2% decrease from 2022, with a fatality rate of 1.27 deaths per 100 million vehicle miles traveled.
Which US city has the most car accidents?
Top 5 Deadliest Cities for Drivers Memphis, Tennessee. 25.96 fatalities per 100,000 residents. Detroit Michigan. 21.47 fatalities per 100,000 residents. Albuquerque, New Mexico. 18.11 fatalities per 100,000 residents. Tucson, Arizona. 17.02 fatalities per 100,000 residents. Kansas City, Missouri.
What is the deadliest state to drive in?
The 2025 report found that: Boston drivers get into an accident every 3.07 years on average. The risk of a collision in Boston is 244% higher than the national average. Out of 200 U.S. cities studied, Boston ranked #1 for having the highest crash frequency, making it the most accident-prone city in the country.
What city is the most accident-prone?
Mississippi Why it tops the list: Mississippi continues to lead the nation in fatal car accidents per 100,000 residents. Death rate: Around 22.2 per 100,000 in recent years. Distracted driving: Mississippi drivers spend nearly 8% of their driving time on phones.
Related Searches
Flight 587 crash videoFlight 587 crash site Todayplane crash in new york after 9/11American Airlines plane crash todayFlight 587 crash victimsAmerican Airlines Flight 587 cause of crashFlight 587 victims on groundPlane crash in New York today
Security and compliance
At DocHub, your data security is our priority. We follow HIPAA, SOC2, GDPR, and other standards, so you can work on your documents with confidence.
Cookie consent notice
This site uses cookies to enhance site navigation and personalize your experience.
By using this site you agree to our use of cookies as described in our Privacy Notice.
You can modify your selections by visiting our Cookie and Advertising Notice.