
Start using our platform today for free and streamline your data collection process!
| Versions | Form popularity | Fillable & printable |
|---|---|---|
| 2008 | 4.8 Satisfied (21 Votes) |
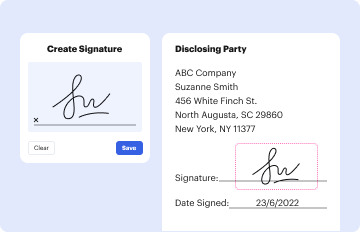
Yes, electronically drawing your signature is appropriate, but only if you use a tool that complies with industry laws and regulations. Consider DocHub, which ensures eSignature validity under ESIGN and UETA requirements. All you need to eSign your free online dot plot generator is an account with DocHub and an internet connection. Once you open your paperwork in our editor, click Sign and select the Draw tool.
If you need to edit your dotplot maker online easily, it does not matter what internet browser you employ. DocHub’s simple editing instruments are available using any internet browser. Simply open the appropriate tab within our editor, add your file, and fill it out without stress.
At DocHub, your data security is our priority. We follow HIPAA, SOC2, GDPR, and other standards, so you can work on your documents with confidence.
Learn more