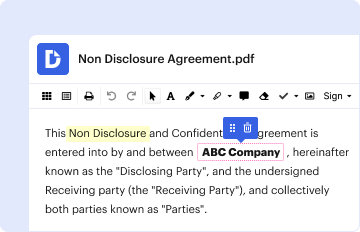
Type text, add images, blackout confidential details, add comments, highlights and more.
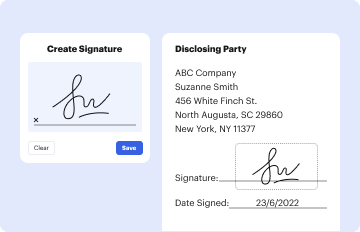
02. Sign it in a few clicks
Draw your signature, type it, upload its image, or use your mobile device as a signature pad.
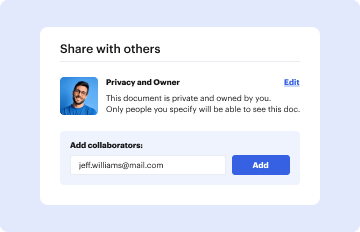
03. Share your form with others
Send time order chart via email, link, or fax. You can also download it, export it or print it out.
How to use or fill out time order chart with our platform
Ease of Setup
DocHub User Ratings on G2
Ease of Use
DocHub User Ratings on G2
Click ‘Get Form’ to open the time-order chart in the editor.
In the center square, enter the main topic of your chart. This will serve as the focal point for your events.
For each event, click on the designated boxes labeled 'Event 1', 'Event 2', etc. Input a brief description of each event that relates to your topic.
On the branching lines connected to each event box, provide additional details or context about those events. This helps clarify their significance and relationship to the main topic.
Review your entries for clarity and completeness. Make any necessary adjustments using our platform's editing tools.
Start using our platform today for free and streamline your document editing experience!
Jun 26, 2025 Case initiation through disposition. (e.g., dismissal, acquittal, or judgment and sentencing). Note: Start counting on the day the case.Read more
Part 1, Main Motions. These motions are listed in order of precedence. A motion can be introduced if it is higher on the chart than the pending motion.Read more
Cookie consent notice
This site uses cookies to enhance site navigation and personalize your experience.
By using this site you agree to our use of cookies as described in our Privacy Notice.
You can modify your selections by visiting our Cookie and Advertising Notice.