
Definition, Meaning, and Purpose of Visualization Software Assessment
Assessment of visualization software usually involves evaluating a range of software tools that enable users to create visual representations of data. This process is essential in fields like construction, architecture, and engineering, where professionals need to perform detailed inspections of sites and structures using visualization technology. Visualization software aids in understanding large datasets by converting them into comprehensive visuals that highlight critical data insights. For instance, such software can enhance construction site inspections by integrating reality capture technologies, thereby allowing professionals to see and analyze as-built data in real time.
Common Use Cases and Examples
-
Construction Site Inspections: Visualization software is frequently used to conduct virtual inspections of construction sites. By utilizing reality capture technologies such as Light Detection and Ranging (LADAR), professionals can gather detailed as-built information, which aids in monitoring construction progress, verifying work quality, and ensuring compliance with plans.
-
Data Analysis and Reporting: In industries handling large volumes of data, visualization tools are pivotal. They offer analytical capabilities that allow stakeholders to generate real-time reports and identify trends or anomalies, thus enabling informed decision-making.
Key Elements of Effective Visualization Software
When assessing visualization software, several key elements should be considered to determine its effectiveness and suitability for specific tasks.
Functional Capabilities
- Data Integration: The software should be capable of handling various data types and integrating information from multiple sources to provide a holistic view.
- User Interface: An intuitive design that facilitates easy navigation and tool accessibility is critical, ensuring users can perform tasks without extensive training.
Performance and Scalability
- Handling Large Datasets: Effective software must adeptly manage large, complex datasets without performance lag, supporting the demands of data-intensive industries.
- Real-Time Processing: The ability to process and visualize data in real time is crucial, especially when conducting live inspections or monitoring sites remotely.
Steps to Use the Assessment of Visualization Software
Initial Setup and Configuration
-
Define Objectives: Clearly establish what you aim to achieve with the visualization software. This involves identifying key metrics and data points that need visualization.
-
Software Selection: Evaluate different software options based on feature compatibility, ease of use, and industry-specific requirements. Consider tools that provide enhanced data integration and visualization capabilities.
Execution and Evaluation
-
Integrate Data Sources: Import and configure necessary datasets from various sources or capture technologies to ensure comprehensive analysis and visualization.
-
Create Visualizations: Utilize built-in tools to create various types of visual representations, such as 3D models, charts, and graphs, to illustrate data insights effectively.
-
Analyze Output: Assess the visualizations for accuracy and relevancy. Verify that the generated visuals accurately reflect the collected data and project objectives.
Business Types that Benefit from Visualization Software Assessment
Industries with High Data Demand
- Construction and Engineering Firms: These businesses rely heavily on visualization software to manage and inspect large-scale projects, ensuring compliance and efficiency.
- Manufacturing Companies: Visualization tools assist in streamlining processes and optimizing production lines through detailed data representations.
Emerging Business Uses
- Real Estate: Agents use visualization software to create virtual tours, providing potential buyers with immersive property views.
- Urban Planning: City planners use these tools to visualize developments and infrastructure changes within urban areas, facilitating informed planning.
Important Terms Related to Visualization Software
Core Terminologies Explained
- Reality Capture Technologies: These refer to technologies such as LADAR and 3D scanning that provide accurate digital representations of physical spaces.
- Meta-data: This is supplementary data that provides information about the dataset being visualized, enhancing its comprehensibility.
Industry Specific Jargon
- As-Built Data: Detailed representations of a construction project as it exists after completion, often used in inspections and retroactive analysis.
- Model-Based Inspections: These involve using digital models to conduct inspections, allowing for advanced analysis of built structures.
Challenges and Considerations in Visualization Software Assessment
Handling Data Size and Complexity
- Scalability: Ensuring the software can expand its capabilities to process and analyze growing volumes of data without degrading performance is vital. Large datasets require robust software capable of maintaining speed and accuracy.
Integration and Interoperability
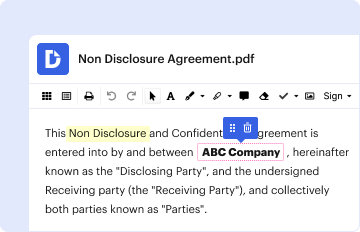
- Compatibility: Visualization software needs to seamlessly integrate with other systems, such as CADs and project management tools, to ensure a smooth workflow.
Legal and Compliance Considerations
Ensuring Compliance in Visualization Tools
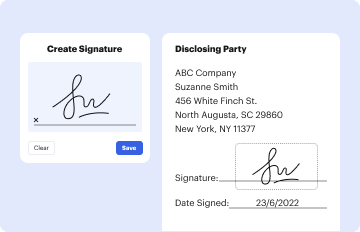
- Legal Binding Features: Some sectors may require software that includes compliance functionalities, such as digital signature capabilities that adhere to the ESIGN Act for legally binding requirements.
Data Privacy and Security
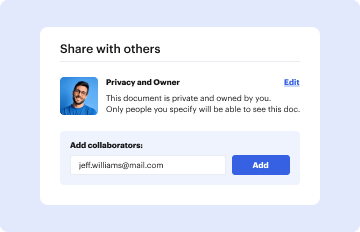
- Data Protection: Implementing strong encryption and authentication measures within the software is essential to safeguard sensitive information being visualized and shared.
Real-World Application Scenarios
Practical Uses and Benefits
-
Case Studies: Numerous firms report increased efficiency and reduced costs by adopting visualization tools, citing examples of streamlined inspections and enhanced data accuracy.
-
Illustrative Scenarios: An engineering firm conducting a structural audit can deploy visualization software to simulate different stress scenarios on a building, helping predict potential failures.
Conclusion: Evaluating Software for Improved Visualization
- In conclusion, the assessment of visualization software encompasses understanding its capabilities, usability, and integration potential. By meticulously evaluating these aspects, businesses can select the software that best meets their operational needs, driving efficiency and informed decision-making.