


Definition & Meaning
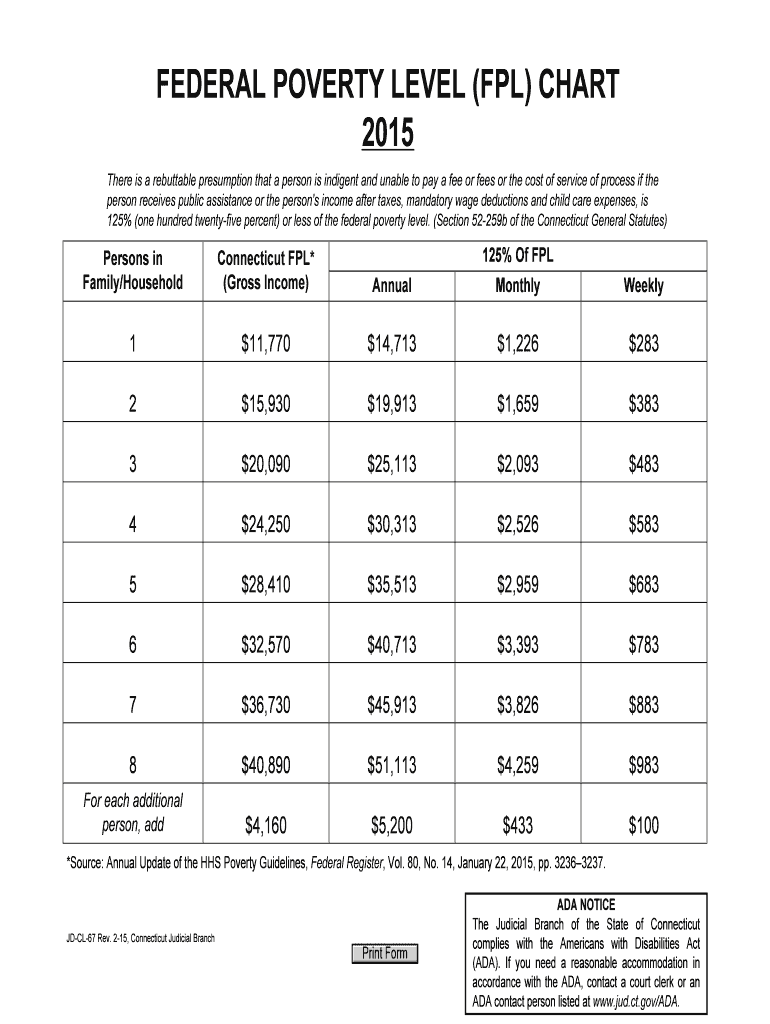
The Federal Poverty Level (FPL) chart for 2011, as provided by the Connecticut Judicial Branch, is a government-issued table that outlines income thresholds used to determine financial eligibility for various public assistance programs and legal aid. These numbers help define what constitutes poverty for households of different sizes, ensuring that those earning below a certain percentage of the FPL are recognized as needing additional support. This chart is essential for setting baseline standards for indigence, used by government entities to facilitate access to necessary resources and services for lower-income individuals and families.
How to Use the Federal Poverty Level (FPL) Chart 2011
Utilizing the FPL chart involves comparing a household’s income against the thresholds listed. Individuals or organizations can identify eligibility for assistance by looking at:
- Household size: Determine the number of people living in a household and find the corresponding row in the chart.
- Income measurement: Use annual, monthly, or weekly income statistics that align with the figures represented in the chart.
- Percent of FPL: Determine programs based on income as a percentage of the FPL, commonly at 125%, 150%, or 200% levels.
The chart serves as a quick reference guide for determining who qualifies for assistance, ensuring that resources are allocated to those most in need.
Key Elements of the Federal Poverty Level (FPL) Chart 2011
- Income Thresholds: The chart delineates income limits for different household sizes, offering guidance on eligibility.
- Household Size: Ranges from one-person households to larger family units, with each size having a distinct threshold.
- Percentage of FPL: Programs often base eligibility not just on the FPL but specific percentages above it, making this element crucial for diverse assistance criteria.
Understanding these key elements helps individuals and advisors accurately assess eligibility for aid programs.
Important Terms Related to Federal Poverty Level (FPL) Chart 2011
- Indigence: The inability to afford basic needs, including legal fees, often defined by income levels at or near the FPL.
- Public Assistance Programs: Governmental initiatives offering financial aid or services to eligible low-income individuals and families.
- Eligibility Criteria: Specific income and household requirements determining who can receive aid based on the FPL.
These terms are integral for comprehending the implications of the FPL chart and its application.
Who Typically Uses the Federal Poverty Level (FPL) Chart 2011
The FPL chart is principally used by:
- Social Service Agencies: To verify eligibility for health, nutritional, and housing assistance.
- Legal Aid Providers: Deciding if clients qualify for pro bono services.
- Charitable Organizations: Ensuring targeted support for low-income households.
The chart guides these entities in properly assisting those within poverty thresholds.

State-Specific Rules for the Federal Poverty Level (FPL) Chart 2011
While the chart offers standard benchmarks, individual states like Connecticut may apply specific rules to define and address poverty:
- Adjusted Thresholds: Some states might use regional cost-of-living adjustments.
- Program-Specific Criteria: State-run assistance programs may have unique eligibility criteria beyond FPL figures.
Awareness of state-specific deviations from federal guidelines is crucial for accurate application.
Legal Use of the Federal Poverty Level (FPL) Chart 2011
The FPL chart determines:
- Qualification for Waivers: Court fees and costs for low-income individuals may be waived based on the chart.
- Eligibility for Guardianship and Custody Matters: Access to legal proceedings may depend on income status.
Legal professionals use the chart’s benchmarks to fairly apply statutes requiring income assessment.
Examples of Using the Federal Poverty Level (FPL) Chart 2011
- Case Study 1: A single mother of two, earning $25,000 annually, checks her eligibility for state-subsidized insurance by comparing her income against the chart’s thresholds for a three-person household.
- Case Study 2: A legal aid service evaluated whether a client qualifies for free representation by seeing if their income falls below 125% of the FPL for their household size.
These scenarios illustrate practical applications of the chart in real-world situations.