Type text, add images, blackout confidential details, add comments, highlights and more.
02. Sign it in a few clicks
Draw your signature, type it, upload its image, or use your mobile device as a signature pad.
03. Share your form with others
Send genre pie via email, link, or fax. You can also download it, export it or print it out.
How to use or fill out genre pie reports with our platform
Ease of Setup
DocHub User Ratings on G2
Ease of Use
DocHub User Ratings on G2
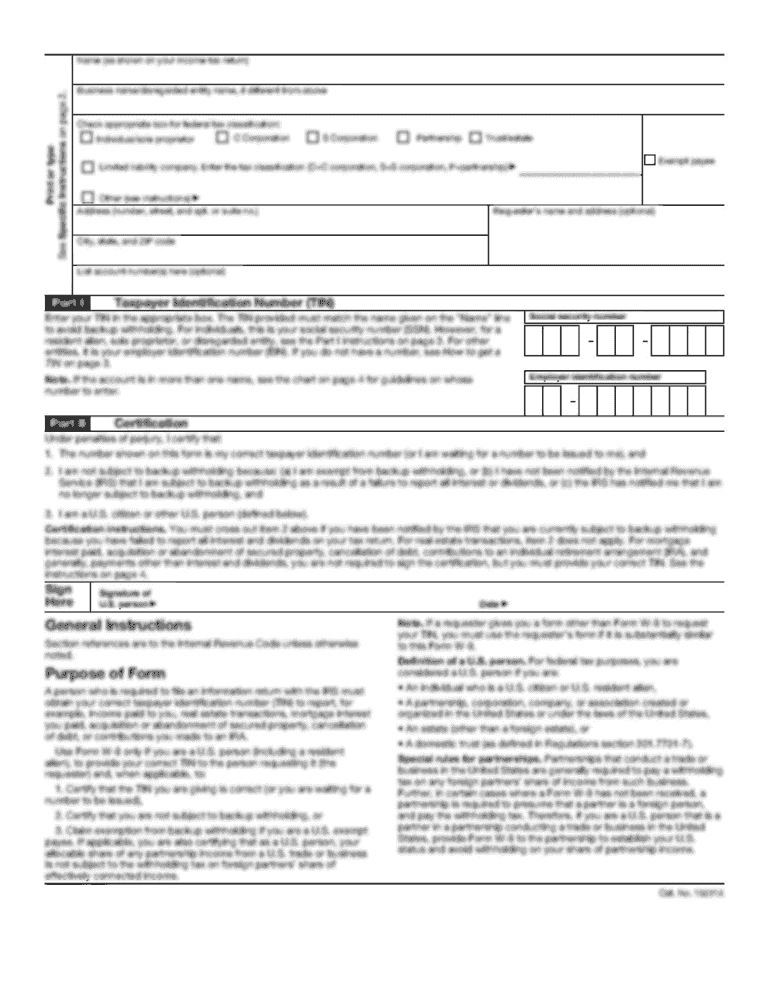
Click ‘Get Form’ to open the genre pie report in the editor.
Begin by entering your name and the date at the top of the form. This personalizes your report.
Next, check the appropriate genre box that best fits the book you are reporting on. Choose from options like Realistic Fiction, Adventure, or Science Fiction.
Fill in the text title and author of the book. This information is crucial for identifying your report.
Answer whether you would recommend this book to a friend by checking 'yes' or 'no', and provide a brief explanation for your choice.
Describe the main character(s) using specific traits and evidence from the text. This section allows you to showcase your understanding of character development.
Detail the setting of the book, providing context for where and when the story takes place.
Identify one conflict in the book and specify its type. This helps illustrate key plot points.
Reflect on why you think the author wrote this book by selecting an option that aligns with your interpretation of their purpose.
Summarize the book in eight or more sentences, covering essential details from beginning to end, including identifying the climax.
Start filling out your genre pie report today for free using our platform!
Genre pie reports spotifyGenre pie reports redditSpotify Pie chart safeMusic Pie ChartSoundcloud Pie ChartPie Chart SpotifyApple Music Pie chartSpotify Pie Receiptify
Security and compliance
At DocHub, your data security is our priority. We follow HIPAA, SOC2, GDPR, and other standards, so you can work on your documents with confidence.
Description: SPANISH: Resume el impacto de la migracin de personas desde sus departamentos, causado por problemas socioeconmicos o por desastres naturales.
Predicting Film Genres with Implicit Ideals - PMC - NIH
by AMG Olney 2013 Cited by 13 We present a new approach to defining film genre based on implicit ideals. When viewers rate the likability of a film, they indirectly express their ideal ofRead more
Cookie consent notice
This site uses cookies to enhance site navigation and personalize your experience.
By using this site you agree to our use of cookies as described in our Privacy Notice.
You can modify your selections by visiting our Cookie and Advertising Notice.