


Definition and Meaning of the JM Climate Pro Coverage Chart
The JM Climate Pro Coverage Chart is a vital tool that illustrates the coverage provided by Johns Manville's Climate Pro A2000 Fiber Glass Blowing Wool insulation. This chart aids in determining the quantity of insulation needed based on various factors, such as the thickness of the insulation, the intended R-value, and the specific conditions of the installation site. Understanding the chart is crucial for contractors and homeowners aiming to achieve optimal thermal resistance in buildings.
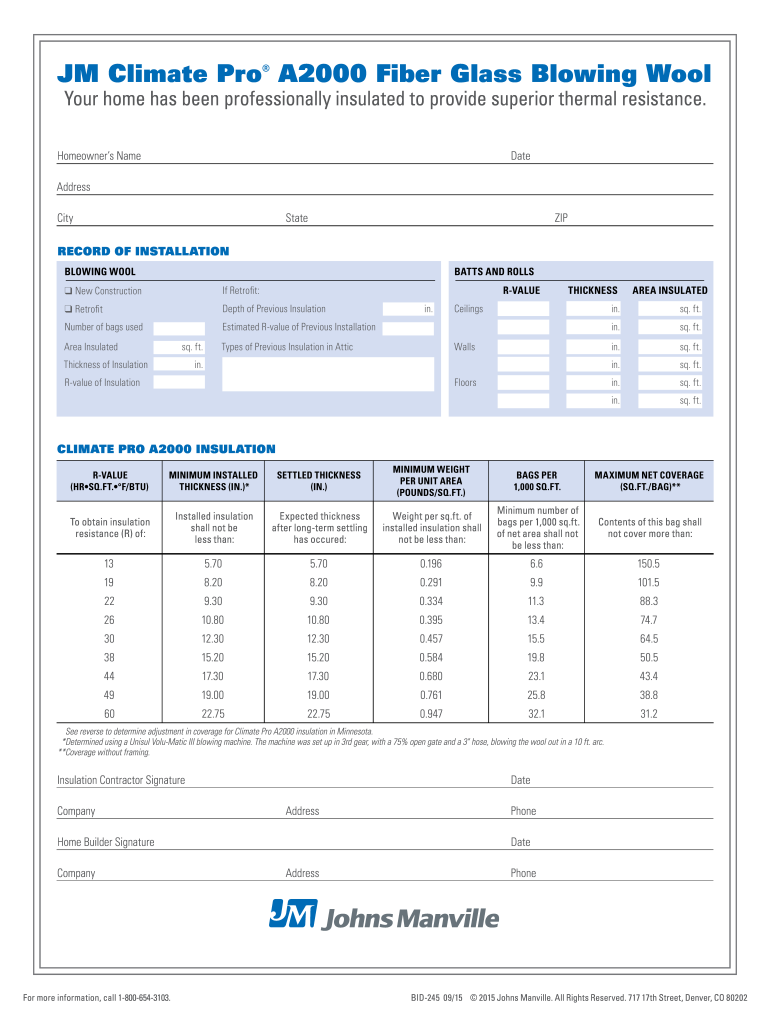
The chart typically includes information on:
- R-Values: Resistance to heat flow, indicating the effectiveness of insulation. The higher the R-value, the better the insulation's effectiveness.
- Recommended Thickness: Guidelines on the required thickness based on the desired thermal performance.
- Coverage Area: Details on how much area a specific quantity of insulation can effectively cover, helping to ensure adequate insulation throughout the structure.
How to Use the JM Climate Pro Coverage Chart
Using the JM Climate Pro Coverage Chart involves several systematic steps to ensure effective application of insulation in residential or commercial buildings. This structured approach not only assists in selecting the right amount of insulation but also enhances the overall energy efficiency of the structure.
- Identify the Area to Insulate: Determine the specific areas of the structure that require insulation, considering factors such as climate zone and building design.
- Select Desired R-Value: Choose the appropriate R-value based on the energy codes or personal efficiency goals. The chart provides options that align with various climates and building types.
- Refer to the Chart: Locate your selected R-value on the chart. This will provide the recommended thickness of insulation needed for optimal performance.
- Calculate Coverage Area: Assess how much insulation is required by calculating the square footage of the area to be insulated and compare this to the coverage figures indicated on the chart.
- Make Adjustments if Necessary: If the desired insulation level is not achievable with the options available, consider alternative products or modifying the insulation strategy to meet energy efficiency criteria.
By following these steps, users can effectively utilize the coverage chart to achieve desired insulation outcomes.
Key Elements of the JM Climate Pro Coverage Chart
Understanding the key elements of the JM Climate Pro Coverage Chart is essential for ensuring proper installation and achieving the intended energy efficiency. The main components are highlighted below:
- R-Value Reference: Each R-value represented correlates with specific levels of insulation effectiveness, catering to varying climate conditions. This ensures that the right type of insulation is chosen based on local building codes and climate specifics.
- Thickness Recommendations: The chart provides clear thickness guidelines that need to be adhered to for optimal performance, reducing heat loss in winter and heat gain in summer.
- Installation Guidelines: In addition to thickness, the chart may offer installation techniques and best practices, ensuring that users not only select the right materials but also apply them effectively.
- Environmental Considerations: Users can see how specific insulation choices affect energy consumption and environmental impact, strengthening decision-making for sustainable building practices.
This comprehensive breakdown of the chart's elements assists users in grasping the full scope of information provided.
Important Terms Related to JM Climate Pro Coverage Chart
Familiarity with essential terms is crucial for effective interpretation and application of the JM Climate Pro Coverage Chart. Below are some key terms:
- Insulation Type: Refers to the material used to achieve thermal resistance, such as fiber glass or foam.
- Thermal Resistance: Indicates how well a material resists the flow of heat, typically measured by R-value.
- Blanket Insulation: A commonly used form that includes batts or rolls, which can be effectively referenced using the coverage chart.
- Blown-In Insulation: A method where insulation materials are blown into spaces using special machinery, typically addressed in the chart for coverage requirements.
- Installation Practices: Specific recommendations outlined in the chart that ensure insulation is applied uniformly and effectively, which impacts overall performance.
Understanding these terms allows users to communicate more effectively about their insulation projects and make informed decisions.
Examples of Using the JM Climate Pro Coverage Chart
Numerous practical scenarios can illustrate how to effectively use the JM Climate Pro Coverage Chart, providing clarity for real-world applications:
- Residential Insulation in Minnesota: For a new home in Minnesota requiring an R-49 insulation level in the attic, the user would locate the R-49 section on the chart, identify the recommended thickness of fiber glass insulation, and calculate the total square footage of the attic space. This informs them about the amount of insulation to purchase.
- Retrofit Project for an Existing Home: A homeowner seeking to upgrade insulation in a retrofitted wall may review the chart for a desired R-30 value. After determining the wall space to be insulated, the homeowner can calculate the number of insulation bags needed based on the coverage data provided by the chart.
- Commercial Building Compliance: A contractor working on a commercial building project must adhere to specific energy codes. By referring to the chart to select insulation with sufficient R-values, they ensure that the installation meets local building regulations.
These examples demonstrate the practical applications of the coverage chart in various insulation scenarios, emphasizing its role in fostering energy efficiency and compliance.