




Definition & Meaning
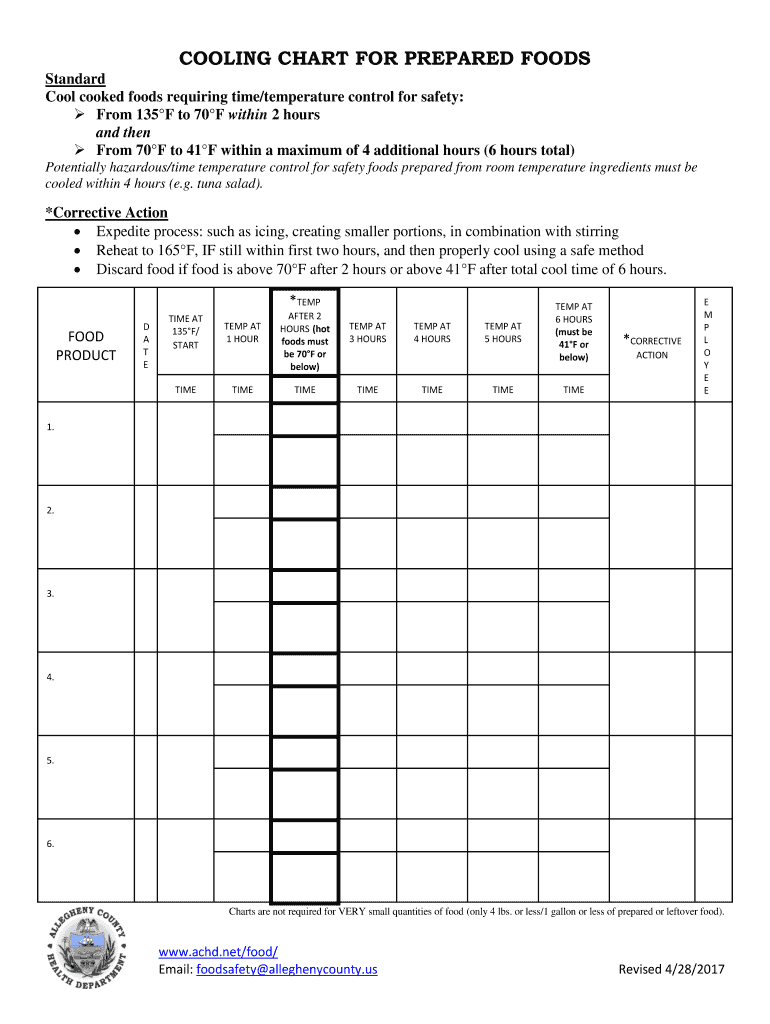
The "Cooling Chart for Prepared Foods" is a specialized document utilized in the food service and hospitality industries to monitor and ensure the safe cooling of cooked foods. This tool helps businesses comply with food safety regulations by documenting the time and temperature conditions under which prepared foods are cooled from high cooking temperatures to safe storage temperatures. Proper cooling is critical to prevent the growth of harmful bacteria and protect public health. The chart acts as a precise record, detailing each stage of the cooling process to ensure it meets regulatory standards.
Key Elements of the Cooling Chart for Prepared Foods
A comprehensive "Cooling Chart for Prepared Foods" includes several essential components to facilitate accurate recording and monitoring:
- Food Item: Specifies the dish or food product being monitored.
- Initial Temperature: The starting temperature of the food immediately after cooking.
- Cooling Start Time: The time at which the cooling process begins.
- Intermediate Temperature Checks: Recorded at specified intervals, typically at two-hour marks, to ensure the food is cooling at the required rate.
- Final Temperature: The temperature at which the food reaches safe storage levels, usually below 41°F.
- Cooling Completion Time: The time when the cooling process ends.
- Employee Initials and Date: Authentication by the person recording the details to maintain accountability.
How to Use the Cooling Chart for Prepared Foods
Utilizing the "Cooling Chart for Prepared Foods" involves systematically monitoring the cooling process of foods to ensure compliance with safety standards. This section provides a structured approach:
- Document Initial Conditions: Immediately after cooking, record the food item and its initial temperature on the chart.
- Start Timing: Note the precise time cooling begins, ensuring rapid action to meet regulatory timelines.
- Regular Checks: Conduct temperature checks at specified intervals (e.g., every two hours) to confirm consistent cooling progress. Record each observation on the chart.
- Verify Completion: Once the food reaches the safe temperature (generally 41°F or below), log the final temperature and time.
- Authenticate Entries: Finish the process by including the recorder's initials and date, ensuring proper documentation and tracking.
Why Should You Use the Cooling Chart for Prepared Foods
Here are compelling reasons for businesses to implement the "Cooling Chart for Prepared Foods":
- Regulatory Compliance: Meet local, state, and federal food safety regulations, reducing the risk of violations and penalties.
- Health and Safety: Minimize the risk of foodborne illnesses by ensuring food is cooled to safe temperatures.
- Quality Assurance: Maintain the quality and flavor of foods by avoiding spoilage due to improper cooling.
- Accountability and Transparency: Record keeping ensures transparency and accountability in food handling processes.
- Audit Preparation: Provide detailed records during inspections or audits, demonstrating adherence to safety protocols.
Steps to Complete the Cooling Chart for Prepared Foods
Executing the cooling process efficiently requires attention to detail in filling out the chart:
- Pre-Cooling Preparation: Prepare the environment and equipment to start cooling immediately after cooking.
- Monitor Initial Temperature: Use a calibrated thermometer to log the starting temperature.
- Start Timing: Begin the cooling timer as soon as conditions allow.
- Maintain a Consistent Record: At regular intervals, measure and document the food temperature on the chart.
- Final Record Check: Once the process is complete, ensure all fields are filled accurately, including the final temperature, date, and signatures.
- Storage: Keep the completed chart for reference during audits or inspections.
Who Typically Uses the Cooling Chart for Prepared Foods
The "Cooling Chart for Prepared Foods" is primarily used by individuals and organizations responsible for food safety, including:
- Restaurants and Cafes: Ensuring food safety throughout meal preparation and storage.
- Catering Services: Managing large-scale food servings with precise cooling needs.
- School and Hospital Kitchens: Protecting vulnerable populations through rigorous food safety standards.
- Food Manufacturing Plants: Monitoring production batches for safe supply chain integration.

Examples of Using the Cooling Chart for Prepared Foods
Various scenarios illustrate the practicality of the chart:
- A busy restaurant kitchen uses the chart to track the cooling of large batches of soup, preventing bacterial growth and ensuring compliance during service peaks.
- A catering company documents their cooling process for prepared salads and entrees, demonstrating adherence to safety standards for event hosting.
- A school's food service department logs cooling data for mass-produced meals, serving hundreds of students daily while maintaining health regulations.