Plot diagram worksheet pdf 2025

Get Form
blank plot diagram pdf Preview on Page 1

Here's how it works

01. Edit your blank plot diagram pdf online
Type text, add images, blackout confidential details, add comments, highlights and more.
02. Sign it in a few clicks
Draw your signature, type it, upload its image, or use your mobile device as a signature pad.
03. Share your form with others
Send plot diagram pdf via email, link, or fax. You can also download it, export it or print it out.

How to use or fill out plot diagram worksheet pdf with our platform

Form edit decoration
9.5
Ease of Setup
DocHub User Ratings on G2
9.0
Ease of Use
DocHub User Ratings on G2
  1. Click ‘Get Form’ to open the plot diagram worksheet in the editor.
  2. Begin by filling out the 'Exposition' section. Here, you can describe the setting and characters of your story. Use text boxes provided to input your information clearly.
  3. Next, move to the 'Rising Action' field. Detail the events that lead up to the climax, ensuring you capture key moments that build tension.
  4. In the 'Climax' section, summarize the turning point of your story. This is where the main conflict reaches its peak.
  5. Proceed to 'Falling Action'. Describe how the characters respond to the climax and what events follow.
  6. Finally, complete the 'Resolution' section by explaining how conflicts are resolved and what happens at the end of your story.

Start using our platform today for free and enhance your document editing experience!

be ready to get more

Complete this form in 5 minutes or less

Get form

Got questions?

We have answers to the most popular questions from our customers. If you can't find an answer to your question, please contact us.
Contact us

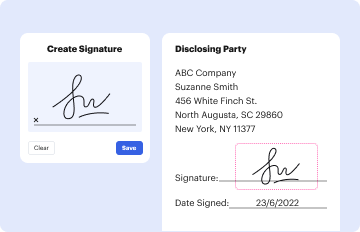
Yes, electronically drawing your signature is appropriate, but only if you utilize a tool that complies with industry laws and regulations. Consider DocHub, which ensures eSignature validity under ESIGN and UETA requirements. All you need to eSign your plot diagram blank pdf is an account with DocHub and an internet connection. When you open your file in our editor, click Sign and select the Draw tool.

Using a swift editing system like DocHub, you do not need anything but a web browser and connection to the internet to modify your blank plot diagram online easily. Add your document or find the relevant form in DocHub’s catalog, open our editor with a single click, and complete it electronically. To edit your forms anytime, sign up a free account with DocHub.
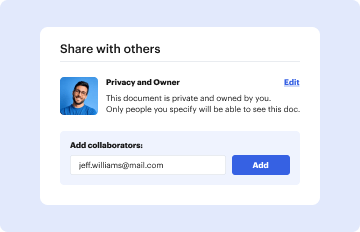
Some fun ways to teach this lesson using Storyboard That: Have students illustrate exposition, rising action, conflict, climax, falling action, and resolution, in a six-cell storyboard. As part of editing, have students diagram their own creative writing to find major plot points.
"We have defined a story as a narrative of events arranged in their time-sequence. A plot is also a narrative of events, the emphasis falling on causality. 'The king died and then the queen died,' is a story. 'The king died, and then the queen died of grief' is a plot.
Exposition. Rising Action. Climax. Falling Action. Resolution.
be ready to get more

Complete this form in 5 minutes or less

Get form

People also ask

Exposition. Rising Action. Climax. Falling Action. Resolution.
The Plot Diagram is an organizational tool focusing on a pyramid or triangular shape, which is used to map the events in a story. This mapping of plot structure allows readers and writers to visualize the key features of stories.
the diagrams.net Google Docs add-on Open a document, or create a new document. Click Add-ons Get Add-ons. Search for diagrams and click on diagrams.net for Docs. Follow the prompts to grant diagrams.net (draw.io) permission to access your Google Documents and files on Google Drive.
There are 5 elements of plot: Exposition. Rising Action. Climax. Falling Action. Conclusion.
Enter the variables and data into the Google Sheet. Select all of the data with your cursor, and then select the \u201cInsert Chart\u201d icon on the toolbar. In the Chart editor \u2192 Setup \u2192 Chart type drop-down menu, scroll down and select Radar Chart. You have created your spider chart/radar chart.

simple plot diagram pdf