


Definition and Overview of the Plot Diagram Template Google Doc
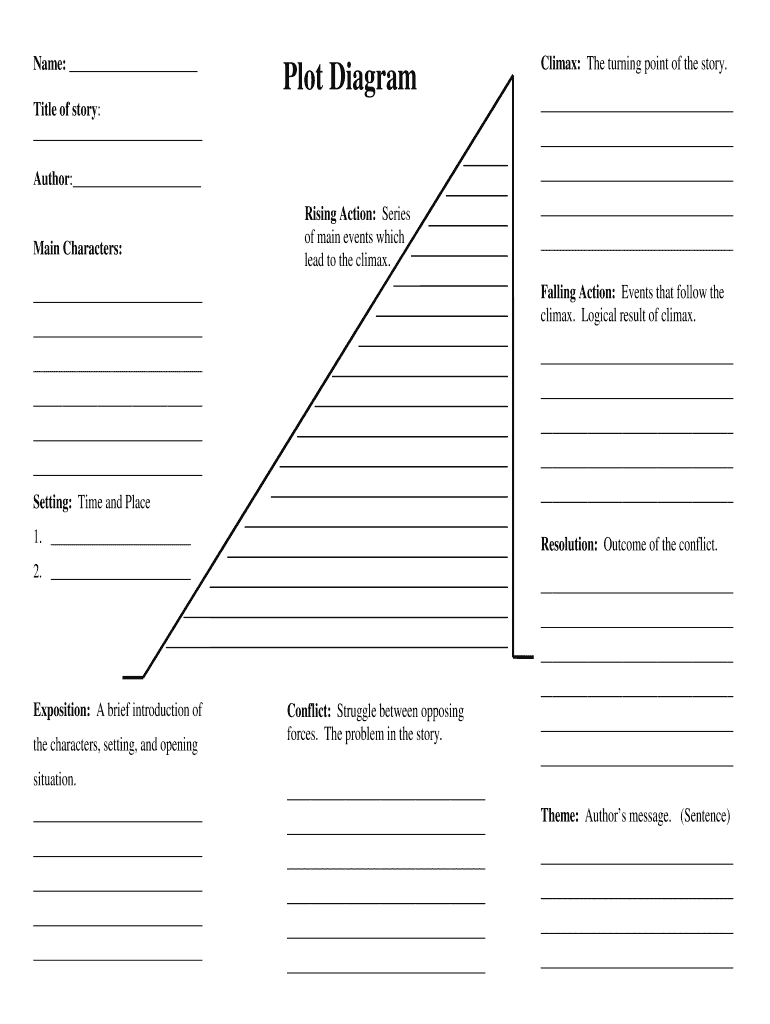
A plot diagram template is a structured visual aid utilized for analyzing narratives by mapping out key elements of a story, including exposition, rising action, climax, falling action, and resolution. This specific template designed for Google Docs facilitates organization and analysis of narrative elements, making it accessible for learners and professionals alike. Users can input information regarding the title, author, and main characters, helping to clarify the narrative arc.
The plot diagram template also serves as a foundational tool in both educational settings and creative writing environments. It allows students and writers to comprehend the structure of stories and ensures that they maintain a coherent flow in their work. The utilization of a plot diagram template in Google Docs enhances collaboration, as it can be easily shared and edited in real-time by multiple users.
Steps for Using the Plot Diagram Template Google Doc
To effectively utilize the plot diagram template within Google Docs, follow these straightforward steps:
- Access Google Docs: Open Google Docs in your web browser and sign into your Google account.
- Locate the Template: In the template gallery, search for “plot diagram template” or navigate through the education section.
- Open the Template: Click on the plot diagram template you wish to use; it will open as a new document.
- Customize the Template:
- Fill in the Title and Author sections.
- Detail the Main Characters involved in your narrative.
- Identify the narrative elements such as Exposition, Rising Action, Climax, Falling Action, Resolution, and Conflict.
- Use the provided sections to add notes about themes and settings.
- Collaborate: Share the document with peers or instructors for real-time feedback or contributions.
- Save and Export: Once completed, you can save the document in your Google Drive or export it in various formats (PDF, DOCX, etc.).
This systematic approach not only aids in completing assignments but also enhances comprehension of narrative techniques.
Key Elements of the Plot Diagram Template Google Doc
The plot diagram template in Google Docs contains essential components that categorize and outline the narrative structure. These elements include:
- Exposition: Introduces the setting and characters.
- Rising Action: Details the events leading up to the climax, building tension and conflict.
- Climax: Represents the turning point where the main conflict reaches its peak.
- Falling Action: Discusses the consequences of the climax and leads toward resolution.
- Resolution: Concludes the story, resolving any remaining conflicts.
- Conflict: Describes the main problem or challenge faced by the characters.
- Theme: Identifies the underlying message or idea conveyed by the narrative.
Understanding these elements enhances the user's ability to dissect stories and helps in both analysis and writing.
Importance of Using the Plot Diagram Template Google Doc
Utilizing a plot diagram template in Google Docs is significant for several reasons:
- Organization: It provides a structured format that helps users arrange their thoughts and ideas around a story systematically. This organization is particularly beneficial for students or writers involved in narrative analysis.
- Clarity: By visualizing the different components of a story, users can gain a clearer understanding of the plot progression and the relationship between various elements.
- Collaboration: The cloud-based nature of Google Docs enables multiple users to work on a document simultaneously, facilitating teamwork in classrooms and writing groups.
- Accessibility: Google Docs can be accessed from any device with internet connectivity, allowing users to work on or update their diagrams at their convenience.
These benefits support effective learning and improve narrative development skills.
Examples of Using the Plot Diagram Template Google Doc
Here are practical scenarios for implementing the plot diagram template in Google Docs:
- Educational Assignments: Students can employ the template to breakdown literary works by authors like Mark Twain or J.K. Rowling, thereby enhancing their understanding of narrative techniques.
- Creative Writing: Aspiring writers may utilize the template to outline their stories before drafting, ensuring that all essential plot points are included and properly sequenced.
- For example, a writer planning a mystery novel might use the plot diagram to chart the initial introduction of characters, the complications leading to the mystery, the climax where the mystery is revealed, and the resolution.
- Presentations: Educators can use the completed plot diagrams in class to illustrate how various narratives abide by traditional plot structures.
In each of these examples, the plot diagram template serves as a vital tool for effective narrative analysis and story crafting.
Advantages of Digital Plot Diagrams Over Paper Versions
There are several advantages to using digital plot diagrams, particularly in Google Docs, compared to traditional paper formats:
- Easy Modifications: Edits can be made quickly without the clutter of crossing out or redoing handwritten work.
- Instant Sharing: Users can share their diagrams with classmates or colleagues instantly, encouraging collaboration and feedback.
- Cloud Storage: Digital documents are saved securely online, minimizing the risk of loss and allowing access from different devices.
- Enhanced Visual Elements: Users can incorporate images, colors, and different fonts to make their diagrams visually engaging, which can enhance understanding and retention.
The transition to digital formats like Google Docs represents an evolution in how users manage, analyze, and engage with narrative structures.