


Definition and Purpose of Semi Log Graph Paper for Sieve Analysis PDF
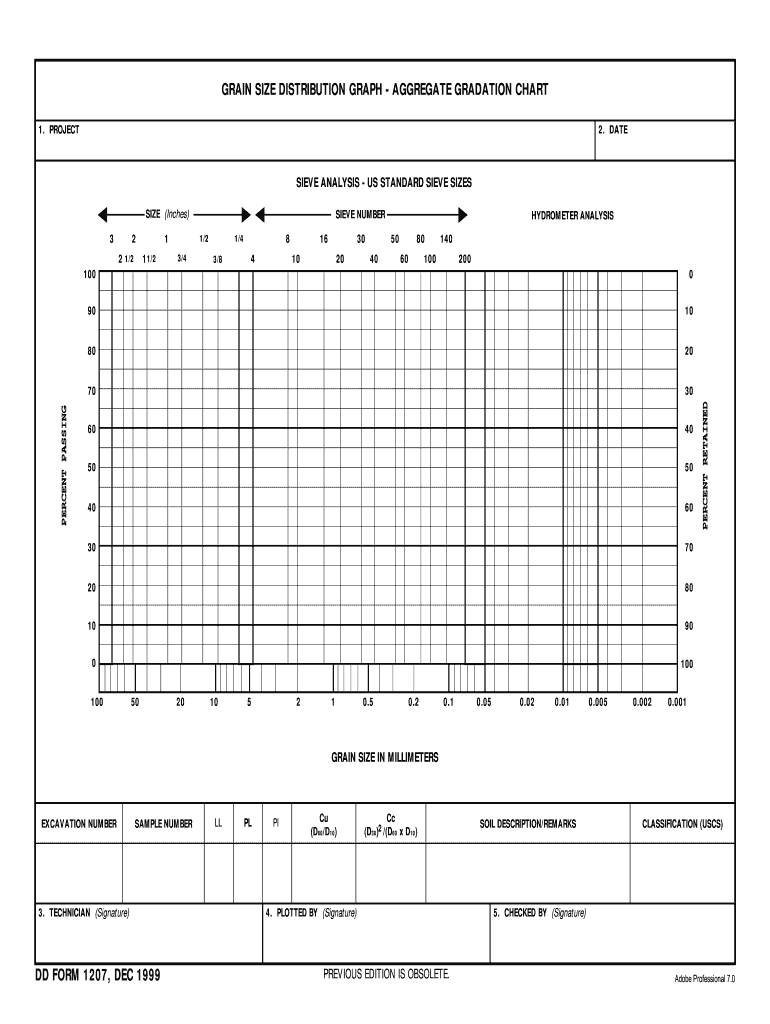
Semi log graph paper for sieve analysis is a specialized tool used in engineering and scientific contexts to visualize and analyze grain size distribution in soil and aggregate materials. The graph paper features a logarithmic scale on one axis and a linear scale on the other. This design allows for easy interpretation of a wide range of particle sizes, which can vary significantly from fine to coarse.
The primary purpose of this graph paper is to plot data obtained from sieve analysis, a method employed to determine the particle size distribution of materials. By using a semi log graph, users can efficiently display data points that might otherwise appear clustered, providing clearer insights into the gradation of soil or aggregate samples.
Key characteristics of semi log graph paper for sieve analysis include:
- Logarithmic Scale: It compresses large ranges of values, effectively representing significant differences in particle sizes.
- Ease of Interpretation: The dual scale format simplifies the identification of trends and patterns in the data.
- Standardized Formats: Many versions are available in PDF for ease of use in digital environments, allowing for printing or direct integration into reports.
How to Use the Semi Log Graph Paper for Sieve Analysis PDF
Utilizing semi log graph paper for sieve analysis involves a series of steps that ensure accurate data representation. Here is a detailed process for effective usage:
- Prepare Data: Gather the results from your sieve analysis, ensuring you have the percent passing for each sieve size you recorded.
- Select the Right Graph: Choose the semi log graph paper appropriate for your analysis, which may be freely available as a PDF download.
- Plot Data Points:
- On the horizontal axis (linear), represent the sieve sizes in millimeters.
- On the vertical axis (logarithmic), plot the percent passing values.
- Draw the Curve: Connect the plotted points to visualize the grain size distribution curve. This curve allows users to easily assess various characteristics of the sample, such as uniformity and gradation.
- Analyze Results: Look for key metrics, such as the D10, D30, and D60 values, which correspond to specific percent passing thresholds. These figures are critical for classifying soils and aggregates according to engineering standards.
Important Terms Related to Semi Log Graph Paper for Sieve Analysis PDF
Understanding the terminology associated with semi log graph paper and sieve analysis is essential for accurate interpretation and communication of results. Key terms include:
- Sieve Analysis: A technique for determining the particle size distribution of granular materials.
- Grain Size Distribution: The composition of different particle sizes present in a sample, typically represented as a curve on the graph.
- D-value: Refers to specific particle diameters where a certain percentage of material (e.g., D60 is the size at which 60% of the material passes through).
- Percent Passing: The fraction of the total mass of material that passes through a given sieve size.
- Uniformity Coefficient (Cu): A ratio that indicates the distribution of particle sizes; calculated by dividing the D60 by the D10.
Examples of Using the Semi Log Graph Paper for Sieve Analysis PDF
To illustrate the practical application of semi log graph paper for sieve analysis, here are a few common scenarios:
- Civil Engineering Projects: Engineers often utilize semilog graphs to determine soil suitability for construction. By plotting grain size distribution, they can classify soil types and assess drainage characteristics.
- Geotechnical Investigations: Geologists use these graphs to evaluate soil profiles for site-specific studies, which inform decisions on foundation design and stability assessments.
- Material Quality Control: Manufacturers of aggregates regularly perform sieve analysis to ensure that their products meet quality specifications. Accurate plotting on a semi log graph helps identify variations in production that may affect material performance.
How to Obtain the Semi Log Graph Paper for Sieve Analysis PDF
Acquiring semi log graph paper for sieve analysis is straightforward, as multiple resources are available, both online and offline. Here is how to obtain these materials:
- Online Sources: Many educational and engineering resource websites offer free downloads of semi log graph paper in PDF format. Search terms such as "semi log graph paper for sieve analysis PDF download" should yield useful results.
- Document Editing Platforms: Use platforms like DocHub to import or create semi log graph templates. You can upload existing files or start from scratch, allowing for customization based on specific project needs.
- Educational Institutions: Universities with civil engineering or geology programs often provide templates for students. Inquire with professors or course coordinators for availability.
By following these methods, individuals can easily access the necessary tools for conducting and presenting their sieve analysis effectively.