


Definition & Meaning
The Candy Temperature Chart is an essential tool for anyone involved in candy making, helping to ensure the precision of temperature measurements required for various types of confections. It is a guide that details the specific temperatures needed to achieve the desired outcome for different candy preparations, such as caramels, toffees, and brittles. Understanding this chart is crucial for maintaining consistency and quality in candy production, as temperature control directly affects the texture and flavor of the final product.
Key Elements of the Candy Temperature Chart
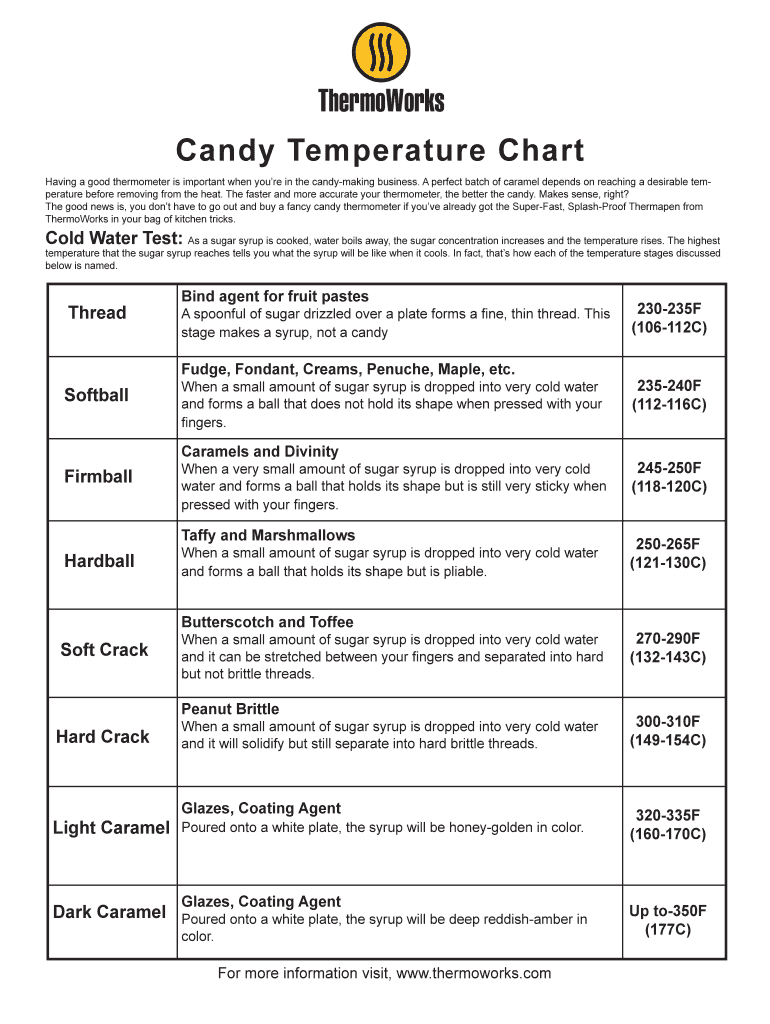
The Candy Temperature Chart typically includes various candy stages, each corresponding to specific temperature ranges. These stages include:
- Thread Stage (230°F - 234°F): Used for making syrups.
- Soft Ball Stage (234°F - 240°F): Ideal for making fudge and pralines.
- Firm Ball Stage (244°F - 248°F): Appropriate for caramels and nougat.
- Hard Ball Stage (250°F - 266°F): Used for divinity and marshmallows.
- Soft Crack Stage (270°F - 290°F): Suitable for butterscotch and taffy.
- Hard Crack Stage (300°F - 310°F): Required for brittles and lollipops.
- Caramel Stage (320°F - 360°F): Used for all forms of caramelized sugar.
Understanding these stages helps ensure each type of candy sets correctly and achieves the desired texture and firmness.
How to Use the Candy Temperature Chart
Using the Candy Temperature Chart involves monitoring candy temperature with a reliable thermometer, often a digital or advanced candy thermometer designed for high-temperature readings. The chart is used to determine when the candy mixture has reached the appropriate stage. To use the chart effectively:
- Prepare the ingredients and combine in a pot over heat.
- Insert the thermometer into the mixture once it starts boiling, ensuring it does not touch the pot's bottom.
- Observe the thermometer, matching the temperature to the appropriate stage on the chart.
- Adjust the heat or remove from the burner upon reaching the desired stage to prevent overheating.
Who Typically Uses the Candy Temperature Chart
The primary users of a Candy Temperature Chart are confectioners, both professional and amateur, who aim to create high-quality candies with precise textures and flavors. This tool is vital in sweet shops, bakeries, culinary schools, and even home kitchens where candy making is practiced seriously. Users include:
- Professional Chocolatiers
- Candy Manufacturing Companies
- Baking Enthusiasts
- Culinary Students
- Home Cooks with a passion for candy making
Each group uses the chart to ensure that their candy-making process yields excellent, predictable results.

Steps to Complete the Candy Temperature Chart
Although the Candy Temperature Chart itself does not require completion, as it serves as a reference, understanding and applying it involves several steps:
- Familiarize Yourself with different candy stages and their corresponding temperatures.
- Gather Equipment, including a reliable candy thermometer and necessary ingredients.
- Conduct a Test Run by making a simple candy recipe to practice monitoring temperatures.
- Cross-reference results with the temperature chart to identify accuracy and consistency.
- Adjust Techniques based on results and challenges faced.
This process helps build confidence and proficiency in using the chart for successful candy production.
Examples of Using the Candy Temperature Chart
Examples of the Candy Temperature Chart in action include:
- Making Fudge: At the soft ball stage, this candy requires precise temperature control to achieve a smooth, creamy texture without crystallization.
- Crafting Hard Candy: Reaching the hard crack stage ensures the candy is brittle and properly set, ideal for lollipops and candy canes.
- Perfecting Toffee: The soft crack stage is vital for creating a crunchy yet pliable texture in toffees.
Each application illustrates the chart's importance in ensuring the preferred texture and taste of different candies.
Important Terms Related to Candy Temperature Chart
Several terms are associated with the Candy Temperature Chart, contributing to a more comprehensive understanding:
- Boiling Point: The temperature at which a specific liquid turns to vapor, vital for candy making.
- Crystallization: A process where dissolved sugar solidifies, often undesirable in candy making.
- Supersaturation: A state where a liquid contains more dissolved material than could be dissolved by the solvent in normal circumstances.
- Caramelization: The browning and flavor change of sugar subjected to heat, crucial for making caramels.
Understanding these terms aids in avoiding common candy-making pitfalls.
Software Compatibility with the Candy Temperature Chart
Though a Candy Temperature Chart itself is not software-dependent, digital tools can enhance the candy-making process. Various applications and software can aid in recipe management and temperature monitoring:
- Candy Thermometer Apps: These digital tools offer real-time temperature tracking and alerts.
- Recipe Management Software: Programs like Paprika or Evernote help organize and store candy recipes along with the temperature chart.
- Cooking Course Platforms: Online services like MasterClass provide instructional content that may incorporate digital charts for food crafts, including candy making.
Integrating technology makes the candy-making process smoother and can increase accuracy.