


Definition and Meaning of Graphing Piecewise Functions Worksheet
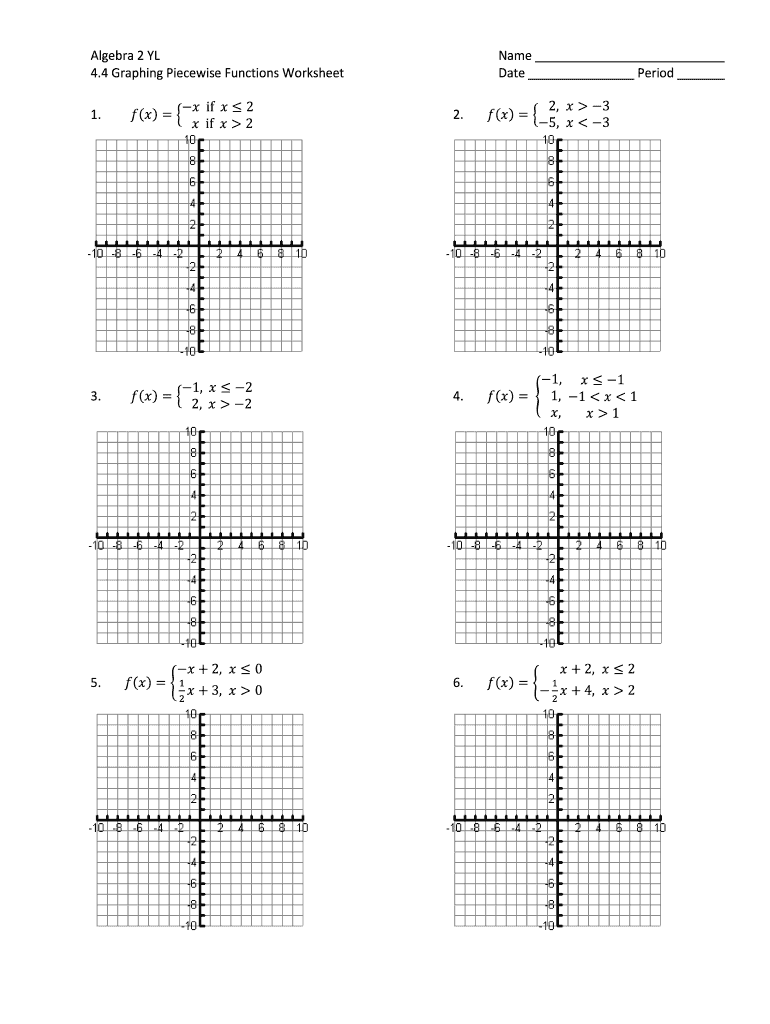
A graphing piecewise functions worksheet serves as a valuable educational resource, particularly for students pursuing algebra studies. This type of worksheet is specifically designed to practice graphing piecewise functions—functions defined by multiple sub-functions, each applicable to a specific interval of the input variable. The structure allows learners to approach the concept of functions from different angles, reinforcing their understanding of how different lines or curves can represent various mathematical relationships within a single graph.
Key definitions include:
- Piecewise Function: A function whose definition varies based on segments of its domain, expressed in segments or 'pieces'.
- Graphing: The process of representing mathematical functions visually using a Cartesian coordinate system.
Worksheets typically include examples, practice problems, and answers, catering to various levels of understanding, from introductory algebra to more advanced mathematical analysis.
How to Use the Graphing Piecewise Functions Worksheet
Using a graphing piecewise functions worksheet involves several steps to ensure effective learning:
-
Understanding the Concept: Before attempting the worksheet, familiarize yourself with the definition and properties of piecewise functions. This foundational knowledge helps when interpreting the problems.
-
Reading Instructions: Each worksheet may have specific directions. Carefully read these to understand the expectations for each problem.
-
Working Through Examples: Most worksheets provide example problems. Reviewing these examples prior to tackling the exercises allows you to see practical applications of piecewise functions.
-
Solving Problems: Attempt each problem systematically. Break down the given function into its respective pieces and identify the intervals for each section. Graph each piece according to its corresponding domain.
-
Reviewing Answers: After completing the exercises, consult the answer key provided with the worksheet to verify your work. Understanding any discrepancies is crucial for mastery.
Steps to Complete the Graphing Piecewise Functions Worksheet
Completing a graphing piecewise functions worksheet can be streamlined into a structured approach:
-
Identify Different Cases:
- Look at the function's conditions to separate it into distinct segments based on their respective domains.
-
Calculate Values:
- For each segment, calculate a few key values (often, it's beneficial to find at least three: one at the endpoint and one in the middle) to define how the function behaves.
-
Choose Graphing Technique:
- Decide whether to graph by hand or use graphing software. Both methods require an understanding of how piecewise functions form.
-
Graph Each Segment:
- Plot each calculated point, drawing lines or curves as necessary. Ensure to indicate open or closed circles for endpoint values based on whether the function includes the endpoints.
-
Label the Graph:
- Properly label each segment of the function with its corresponding piece and indicate the intervals they apply to for clarity.
Examples of Using the Graphing Piecewise Functions Worksheet
To better understand the effectiveness of a graphing piecewise functions worksheet, consider these illustrative examples:
-
Example One: A function defined as f(x) = { x^2 for x < 0; 2x + 1 for x ≥ 0}. This requires graphing a parabola for negative x values and a straight line for non-negative values.
-
Example Two: A piecewise function like f(x) = { 3 for x < 1; x + 1 for 1 ≤ x < 3; 2 for x ≥ 3} can be graphed as a constant line up to x equal to one and then as a line for the interval [1, 3] before returning to a constant line.
In each case, students should utilize the provided answers in the worksheet to confirm their accuracy in creating these visual representations.
Who Typically Uses the Graphing Piecewise Functions Worksheet
A graphing piecewise functions worksheet is primarily utilized by:
- High School Students: Those enrolled in algebra courses as they explore advanced function concepts.
- College Students: In pre-calculus or calculus classes, where piecewise functions are foundational to understanding more complex topics like limits and derivatives.
- Educators: Teachers may utilize these worksheets in classroom settings to reinforce mathematical skills and provide additional practice outside of standard textbooks.
- Tutors: Educational support personnel assisting students in mastering algebraic concepts may regularly incorporate these worksheets to target specific learning challenges.


Important Terms Related to Graphing Piecewise Functions
Understanding certain key terms is essential when working with piecewise functions:
- Domain: The complete set of possible values (inputs) that the function can take.
- Range: The set of output values that the function can produce based on its domain.
- Continuity: A property of functions that indicates whether there are any breaks or jumps in the graph.
- Endpoints: Specific values in piecewise functions that can determine if certain segments of the function are open or closed.
Familiarity with these terms enriches the user's ability to effectively interpret and utilize a graphing piecewise functions worksheet.