
Start using our platform today to create and customize your Tree Map Flow Chart for free!
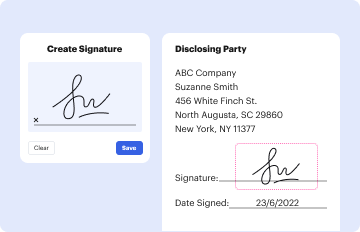
Based on eSignature laws, forms approved electronically have the same validity as those approved with pen and paper. You can eSign almost any business and personal documentation. Four types of paperwork still call for handwritten signatures only - wills and testamentary trusts, court orders and other court papers, state statutes regulating divorce, adoption, or other family law, and notice of cancellation of utility services. If you follow the rules and utilize a trustworthy and compliant software solution, like DocHub, you can eSign your Tree Map Flow Chart without printing it.
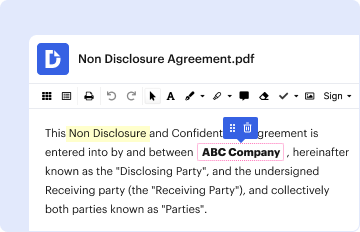
With DocHub, there are several convenient ways to edit your Tree Map Flow Chart online. You can drag and drop the form and edit it directly at the DocHub site or use our browser extension to fill out your form right away. On top of that, you can edit your PDF on your smartphone, as DocHub is compatible with all the accessible mobile platforms.
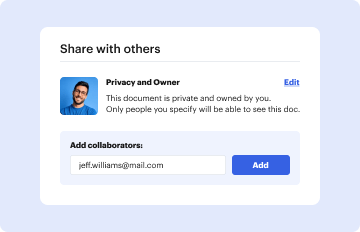
At DocHub, your data security is our priority. We follow HIPAA, SOC2, GDPR, and other standards, so you can work on your documents with confidence.
Learn more