


Definition & Meaning
A behavior frequency chart serves as a systematic tool for tracking specific behaviors over time, typically utilized within educational settings. By recording the occurrence of particular behaviors, educators and specialists can identify patterns, monitor progress, and assess the effectiveness of interventions.
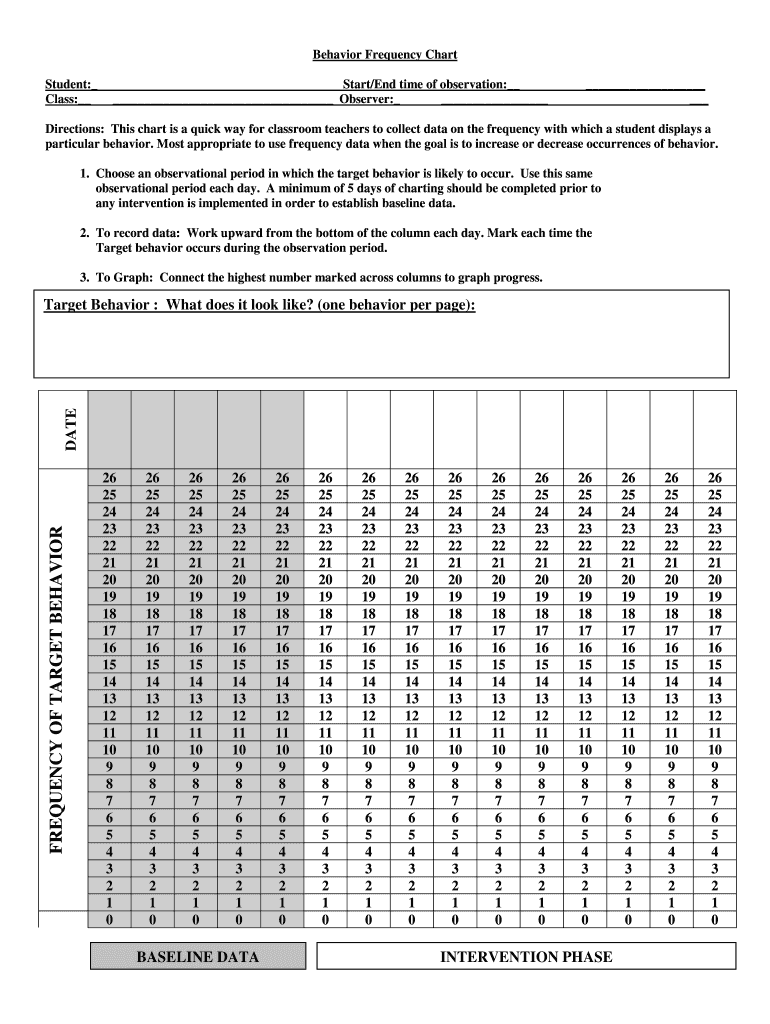
The primary function of this chart is to provide a simple means of documenting how often certain behaviors are exhibited by students or individuals in various scenarios. This documentation can aid in behavioral assessments, inform intervention strategies, and facilitate communication between educators, parents, and support staff.
Key features of the behavior frequency chart include:
- Identification of target behaviors to monitor
- Clear documentation of frequency over specified time intervals
- A visual representation of behavior trends, which can be graphically displayed
- Support for data-driven decision-making in educational and therapeutic contexts
How to Use the Behavior Frequency Chart
Utilizing a behavior frequency chart effectively involves several key steps to ensure accurate and meaningful data collection.
-
Identify Target Behaviors: Determine which specific behaviors you intend to monitor. This could vary from classroom disruptions to positive engagement in activities.
-
Set Observation Periods: Define the time frame for observations. This could be daily, weekly, or during specific class periods to ensure consistent data collection.
-
Record Frequency: During observation periods, mark each incidence of the target behavior. Establish clear criteria for what constitutes an occurrence to promote reliability.
-
Analyze Data: After collecting data over a defined period, review the entries to identify patterns or trends. This analysis can inform necessary interventions or adjustments to teaching strategies.
-
Graph Results: Visual representation of data, through graphs or charts, enhances comprehension and facilitates easier communication with stakeholders.
Understanding how to use this chart aids in creating a structured approach to behavior tracking, which can lead to improved outcomes for individuals monitored.
How to Obtain the Behavior Frequency Chart
Obtaining a behavior frequency chart can be accomplished through various means, ensuring accessibility for educators and specialists.
-
Downloadable Templates: Many educational websites offer free downloadable templates in PDF or other formats. Users can customize these documents to meet their specific requirements.
-
Educational Software: Some educational software and platforms include built-in tools for creating behavior frequency charts, simplifying the process. These tools often allow for easy data entry and analysis.
-
Create Your Own: Users can design personalized charts using spreadsheet software like Microsoft Excel or Google Sheets. This approach provides flexibility in layout and formatting.
-
Consult with Professionals: Educational consultants and behavior specialists may offer resources or specific tools tailored to client needs, which can include customizable behavior frequency chart formats.
By knowing where and how to obtain these charts, educators can readily incorporate them into their practice.
Steps to Complete the Behavior Frequency Chart
Completing a behavior frequency chart requires systematic observation and documentation. Adhering to a structured approach ensures the data collected is reliable and actionable.
-
Prepare the Chart: Ensure that the chart is easily accessible and organized. Clearly label sections for target behaviors and observation dates.
-
Conduct Observations: Engage in regular observations, noting every instance of the target behaviors without bias. Consistency is key; use the same criteria throughout the observation period.
-
Fill in Data: Immediately record each observed behavior, maintaining accuracy in frequency counts. Utilize tally marks or numerical entries for quick data collection.
-
Review Form: After completing the designated observation period, review the chart for completeness. Ensure all entries are clear, consistent, and accurately recorded.
-
Interpret Data: Analyze the totals and any patterns that emerge. This may involve comparing frequencies across different time frames or situations to assess behavior changes.
Completing the behavior frequency chart with care and attention to detail enhances its effectiveness as a tracking tool.
Who Typically Uses the Behavior Frequency Chart
The behavior frequency chart is widely used by various professionals across educational and therapeutic settings. Understanding the roles of these users can help contextualize its application.
-
Classroom Teachers: Frequently utilize the chart to monitor student behavior, identify areas for intervention, and inform instructional strategies.
-
Special Education Professionals: Use the chart to document behavioral progress and inform individualized education program (IEP) goals for students with unique needs.
-
Behavior Analysts: Professionals in behavioral psychology employ frequency charts as part of functional behavior assessments, which guide the development of behavior intervention plans.
-
School Counselors: Employ the charts to assess student behaviors in different contexts and to facilitate discussions with parents or guardians about student progress.
-
Parents and Caregivers: They may use the frequency chart to track and discuss their children's behaviors with educators and specialists, aiming to foster effective communication.
The behavior frequency chart's versatility makes it a vital tool in various fields focused on behavior assessment and intervention.


Key Elements of the Behavior Frequency Chart
Several key elements define the structure and utility of a behavior frequency chart, enhancing its effectiveness for users.
-
Target Behaviors: Clearly outline which behaviors are being tracked to provide a focused approach.
-
Observation Period: Specify the duration of observation, which can help contextualize data within time frames.
-
Frequency Counts: Include sections for entering numerical data, allowing straightforward tracking of how often behaviors occur.
-
Additional Notes: Creating space for commentary can provide context to the recorded behaviors (e.g., triggers, environmental factors) and enhance analysis.
-
Graphical Representation: The ability to visualize data through graphs can make trends clear and allows for easy presentation to stakeholders.
Inclusion of these elements fosters a comprehensive approach to behavior tracking, improving both clarity and function.