Type text, add images, blackout confidential details, add comments, highlights and more.
02. Sign it in a few clicks
Draw your signature, type it, upload its image, or use your mobile device as a signature pad.
03. Share your form with others
Send online venn diagram via email, link, or fax. You can also download it, export it or print it out.
How to use or fill out fill in venn diagram with our platform
Ease of Setup
DocHub User Ratings on G2
Ease of Use
DocHub User Ratings on G2
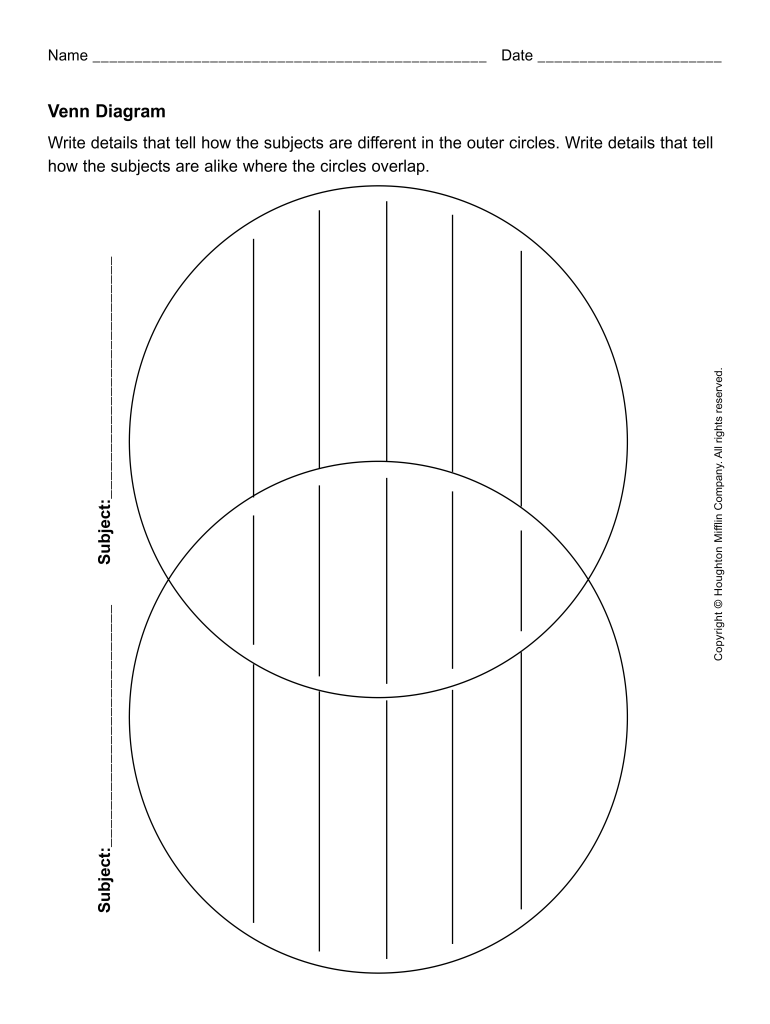
Click ‘Get Form’ to open the fill in venn diagram in the editor.
Begin by entering your name and date at the top of the form. This personalizes your document and ensures proper identification.
In the first subject circle, input the name of the first subject you are comparing. This will help define the focus of your analysis.
In the second subject circle, enter the name of the second subject. Make sure both subjects are clearly labeled for easy reference.
In the outer circles, write details that highlight how each subject differs from one another. Use bullet points or short phrases for clarity.
In the overlapping section, detail how both subjects are alike. This is crucial for understanding their similarities and fostering a comprehensive comparison.
Start using our platform today to effortlessly complete your venn diagram online for free!
What is the formula for the 3 variable Venn diagram?
Venn Diagram Formulas Some basic Venn Diagram formula of 2 or 3 elements are discussed below: n ( X Y) = n (X) + n(Y) - n( X Y) n ( X Y Z) = n(X) + n(Y) + n(Z) - n( X Y) - n( Y Z) - n ( Z X ) + n( X Y Z)
How to fill out a Venn diagram?
Creating Venn Diagrams with Three Sets Start with the intersection of the three sets, then address the regions that involve the intersection of two sets. Next, complete the regions that involve a single set, and finally address the region in the universal set that does not intersect with any of the three sets.
How to fill in Venn diagram probability?
In order to calculate probabilities from a Venn diagram: Determine the parts of the Venn diagram that are in the subset. Calculate the frequency of the subset. Calculate the total frequency of the larger set. Write the probability as a fraction, and simplify.
How do you fill a Venn diagram with 3 circles?
1:13 17:31 And problem solving with the Venn diagrams. Always deal with the intersection. First especially onceMoreAnd problem solving with the Venn diagrams. Always deal with the intersection. First especially once if you want to illustrate this information.
What is the triple Venn diagram rule?
A Venn diagram uses overlapping circles to show how different sets are related to each other. In a three-circle Venn diagram, three different sets of information are able to be compared, and it is where all three circles intersect that you are able to find the items that share all of the characteristics of each circle.
printable venn diagram
Venn diagram generator AIVenn diagram generator with textSimple Venn diagram generatorVenn diagram generator from dataFill in venn diagram calculatorFill in venn diagram 3 circlesFill in venn diagram 2 circlesFill in venn diagram 4 circles
Security and compliance
At DocHub, your data security is our priority. We follow HIPAA, SOC2, GDPR, and other standards, so you can work on your documents with confidence.
How to make a Venn diagram using the shape library in MS Word In Word, go to Insert Illustrations Shapes. A drop-down menu will appear. Add shapes and lines from the shape library to build your Venn diagram. Add text with a text box. Move shapes and text boxes to create your Venn diagram. Save your document.
venn diagram docs
Venn Diagram
- After students have examined two (or more) ideas or read two (or more) texts, have them complete the Venn diagram. Ask students leading questions for each.Read more
Directions: Complete the Venn diagram below by writing down differences and similarities about the topic or source. Your teacher will let you know theRead more
Cookie consent notice
This site uses cookies to enhance site navigation and personalize your experience.
By using this site you agree to our use of cookies as described in our Privacy Notice.
You can modify your selections by visiting our Cookie and Advertising Notice.