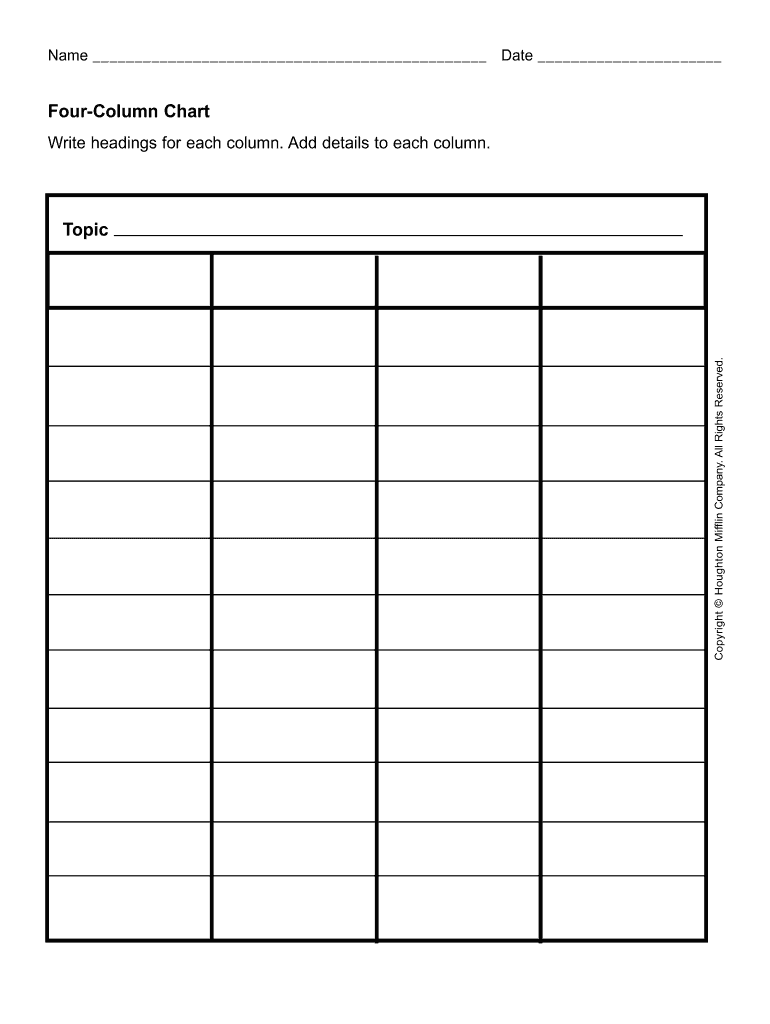

Definition and Meaning of Blank Table Chart
A blank table chart is a tool used for organizing information in rows and columns, serving as a template for data entry. It typically includes empty cells for data input, making it versatile for various applications, from business reporting to educational purposes. This structured format allows users to present and analyze information clearly, facilitating quick data reference and retrieval. Users can customize the number of rows and columns based on their specific needs, creating templates that suit different data types and purposes.
People often utilize blank table charts as a visual aid to simplify complex information. For instance, businesses may use them to compare product features side by side or to list client information systematically. By presenting data in an organized manner, blank table charts help enhance clarity, making it easier to interpret and analyze data at a glance.
How to Use the Blank Table Chart
Using a blank table chart effectively requires understanding your data needs and the purpose of your analysis. Here are some steps to utilize it efficiently:
- Define the Purpose: Determine what information needs to be collected and how it will be used. This will guide the structure of your table.
- Create Columns and Rows: Based on your data requirements, decide how many columns and rows you will need. Each column should represent a category of information, while each row represents individual entries.
- Label Your Table: Clearly label each column with appropriate headings to provide context for the data being entered.
- Input Data: Enter relevant data into each cell corresponding to the appropriate row and column. Ensure accuracy and completeness when populating the table.
- Review and Analyze: Once the data is inputted, review the table for any discrepancies or areas that may require further analysis. This step can involve calculations or comparative analysis across rows or columns.
Utilizing a blank table chart can significantly enhance your organization's ability to manage and interpret data, leading to better decision-making.
Steps to Complete the Blank Table Chart
Completing a blank table chart involves several steps to ensure that data is not only accurately entered but also easy to understand. Here are the critical steps:
- Start with a Blank Template: Open your blank table chart template, ensuring it fits your required format (e.g., number of columns).
- Identify Required Information: Outline the types of information you need to fill in, such as names, dates, categories, or numerical values.
- Fill in Column Headers: At the top of each column, input clear and descriptive headers that reflect the type of data to be included.
- Add Rows for Entries: Under each header, add rows for individual entries. Depending on your needs, you can also leave space for additional entries later.
- Complete the Data Fields: With your headers in place, proceed to fill in the necessary data into the corresponding cells. Ensure that each entry is relevant and accurate.
- Format for Clarity: Utilize formatting options such as bold headers, different colors, or borders to enhance the readability of your table.
- Double-Check Your Work: Finally, review the completed table for mistakes or omissions before finalizing it for use.
By following these structured steps, you can create a well-organized, functional blank table chart that meets your data management needs.
Key Elements of the Blank Table Chart
Understanding the key elements of a blank table chart enhances its usability and effectiveness. Here are the essential components:
- Columns and Rows: The structure of a table chart is based on columns and rows. Each column typically represents a specific category of data, while rows are used for individual records or observations.
- Headers: The headers of columns define what data each column will contain. Clear, concise headers help convey information effectively.
- Cells: The intersections of rows and columns create cells where data is entered. Each cell holds a value or information corresponding to its row and column.
- Formatting Options: Formatting elements such as borders, shading, and font styles can help differentiate header rows from data rows, improving overall readability.
- Data Types: Different types of data can be included within the cells, ranging from text and numbers to dates and percentages, depending on the table’s purpose.
These elements work together to create a functional, efficient tool for data organization and presentation.
Examples of Using the Blank Table Chart
Blank table charts are highly versatile and applicable across several fields. Below are examples demonstrating their use:
- Educational Settings: Teachers can create blank table charts for students to fill in facts about a particular topic, such as historical events or scientific classifications. This type of chart aids in learning through structured data entry.
- Business Reports: In a business environment, teams may use a blank table chart to compare sales data across different regions. This comparison can visually depict performance metrics and facilitate discussions during meetings.
- Project Management: Project managers might deploy blank table charts to track project timelines and milestones. Rows can represent different tasks, while columns indicate the responsible parties, deadlines, and statuses.
- Event Planning: Event coordinators can utilize these charts for organizing guest information, seating arrangements, or budgeting elements. A clear visual representation helps streamline coordination efforts.
- Personal Use: Individuals can create blank table charts for personal budgeting or planning tasks, effectively managing everyday activities or expenses in a clear, organized manner.
These examples illustrate how blank table charts can serve varying needs, from educational purposes to professional management and personal organization, enhancing overall data clarity.
Legal Use of the Blank Table Chart
Blank table charts can also have legal implications, especially concerning documentation and compliance needs. Here are relevant points to consider:
- Documentation: In legal settings, a blank table chart may be used to capture necessary data for contracts, agreements, or compliance reports, ensuring clarity in data presentation.
- Regulatory Compliance: Industries subject to regulations, such as finance or healthcare, may require specific formats for documenting information. Using a standardized blank table chart can meet these requirements, aiding in audits or inspections.
- Evidence Presentation: In legal contexts, a well-structured table chart may assist in presenting evidence clearly, summarizing facts methodically, which can be beneficial during trials or negotiations.
- Record Keeping: Maintaining accurate records in table format can help organizations comply with legal mandates regarding data retention and access. This ensures that important information is easily retrievable and demonstrably organized.
Understanding the legal context in which blank table charts operate enhances their value as organizational tools, ensuring compliance with industry standards and regulations.


