


Understanding Partial Interval Recording Data Sheets
Partial interval recording data sheets are essential tools used by educators and behavior analysts to track and analyze specific student behaviors within designated time frames. This method allows for precise documentation of behaviors, fostering effective behavioral interventions and support.
What is Partial Interval Recording?
Partial interval recording is a time-sampling method utilized to observe and record the occurrence of specific behaviors during predetermined intervals. This technique is particularly beneficial in settings such as schools and therapeutic environments where monitoring behavior is necessary for developing effective strategies. In this approach, the observer notes whether the target behavior occurs at any point during the interval, rather than focusing on the frequency or duration.
Key Elements of a Partial Interval Recording Data Sheet
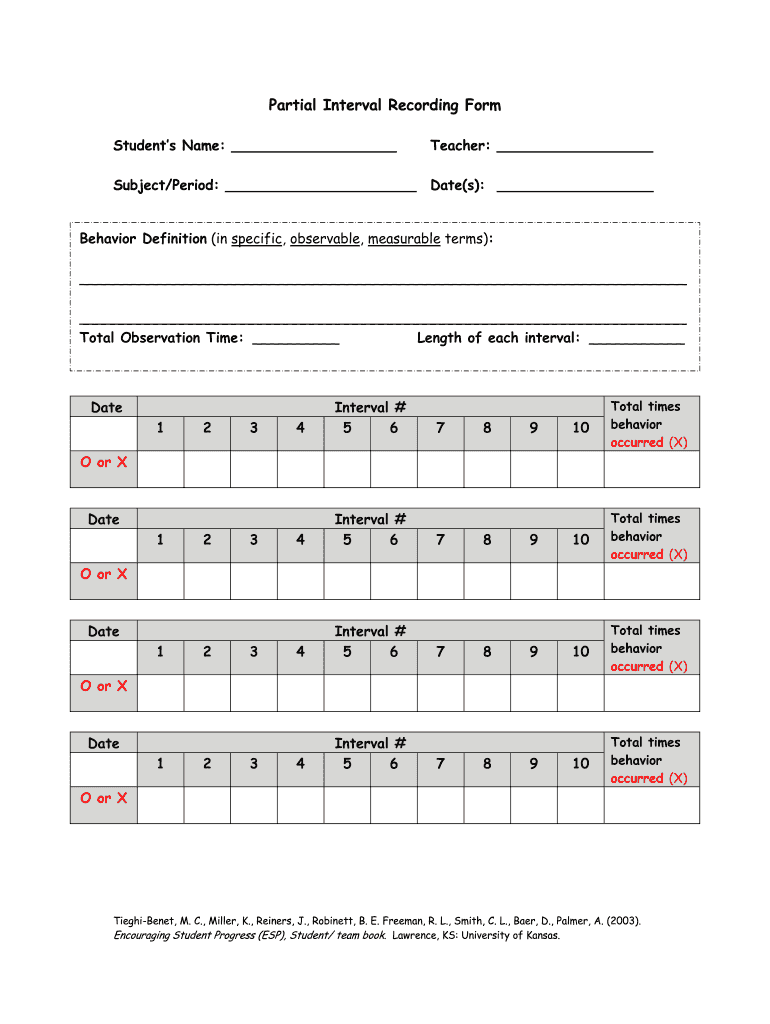
A typical partial interval recording data sheet includes several components that facilitate detailed tracking of behaviors. The following elements are vital for thorough documentation:
-
Behavior Definitions: Clearly outline the target behaviors to ensure consistency in observations. Precise definitions facilitate accurate data recording and minimize ambiguity.
-
Observation Times: Specify the intervals during which observations take place. This section can indicate time slots or specific dates, allowing for comparative analysis across different observation periods.
-
Data Tracking: Spaces to record occurrences of the behavior during each interval. This can be noted using symbols or numerical entries that represent whether the behavior was observed (e.g., yes/no or a tally mark).
-
Additional Notes: An area for recording contextual information or specific observations that may impact behavior, such as environmental changes or interactions with peers.
Advantages of Using Partial Interval Recording Data Sheets
Implementing partial interval recording has numerous benefits, including:
-
Objective Measurement: This method provides an objective measure of behaviors, reducing subjective bias in observations. The data collected can help form a clear picture of behavioral patterns over time.
-
Behavior Pattern Analysis: By collecting data across multiple intervals, educators and analysts can identify peaks in behavior occurrence, allowing for targeted interventions during specific times.
-
Compliance with Educational Standards: Regular tracking of student behaviors aligns with Response to Intervention (RTI) frameworks and other educational standards aimed at monitoring student progress.
When to Use Partial Interval Recording
Partial interval recording is most effective in the following scenarios:
-
Short-Term Behavior Change Goals: When the aim is to observe the immediate effects of an intervention or teaching strategy, partial interval recording can highlight changes in student behavior over time.
-
When Behaviors are Frequent: If the target behavior occurs frequently and continuous recording is impractical, utilizing partial intervals helps capture the occurrence without exhaustive logging.
Creating an Effective Partial Interval Recording Data Sheet
To design an efficient data sheet, consider the following steps:
-
Define Behaviors: Include a detailed definition of each behavior being recorded. Use clear and concise language to ensure clarity for all observers.
-
Establish Observation Criteria: Determine the length of intervals (e.g., 10-minute segments) and how many intervals will be observed on a given day.
-
Create a User-Friendly Format: Design the layout to facilitate quick note-taking. Organized rows and columns for behaviors, times, and notes enhance usability.
-
Pilot the Data Sheet: Test the sheet in a real observing scenario. Gather feedback and make adjustments to improve its efficiency and effectiveness.
-
Train Observers: Ensure that all individuals using the data sheet understand how to apply the methodology consistently, focusing on the specific definitions and observation intervals.
Conclusion on the Use of Partial Interval Recording Data Sheets
Partial interval recording data sheets serve as invaluable resources for educators working to improve student behavior through systematic observation and data collection. By providing structure to behavioral tracking, these tools empower educators and analysts to develop effective interventions, tailoring support to meet the needs of each student.