


Definition and Meaning of the Urine Frequency / Volume / Leaks Chart
The Urine Frequency / Volume / Leaks Chart is a specialized document used for tracking and recording various aspects of urination. This chart allows patients to document the timing, volume, and instances of urinary leakage experienced over a specified period. Healthcare professionals often request this information to assess bladder function and urinary health, making it an important tool for diagnosing and managing conditions related to urinary frequency and incontinence.
Understanding the contents of this chart is essential for patients who wish to monitor their urinary patterns accurately. By recording specific data points, individuals can provide critical insights into their urination habits, which healthcare providers can then use to determine if there is an underlying medical condition. Common conditions that may necessitate the use of this chart include urinary tract infections, overactive bladder, and prostate issues, among others.
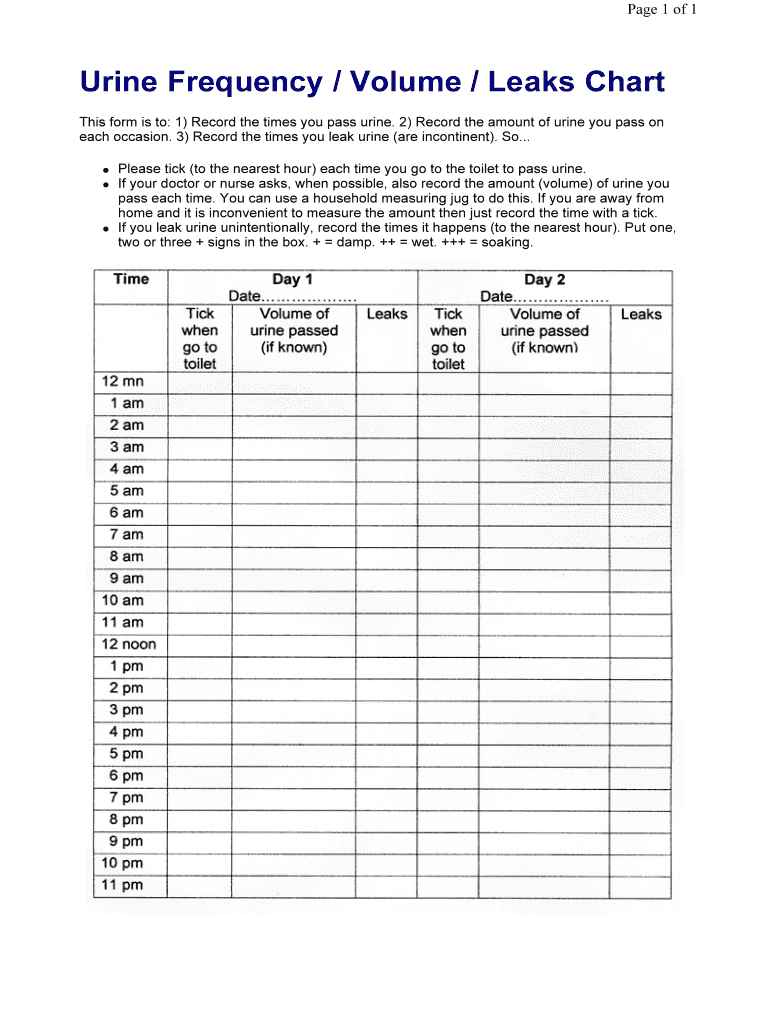
The primary components of the chart include:
- Date and Time: Sections for logging when urination occurs.
- Volume of Urine: Space to note the amount of urine voided, often measured in milliliters.
- Instances of Leaks: Areas designated for recording any involuntary leaks experienced.
The careful completion of this chart not only assists in proper diagnosis and treatment planning but also empowers patients to take active roles in managing their health.
How to Use the Urine Frequency / Volume / Leaks Chart
Using the Urine Frequency / Volume / Leaks Chart effectively involves several steps to ensure accurate data collection. The following guidelines will help you in utilizing this chart:
-
Gather Materials: Obtain a printed or digital version of the urine output chart. Ensure it is accessible for daily recording.
-
Select a Tracking Period: Choose a time frame for monitoring urination habits, typically recommended as three days to one week. This duration allows for a comprehensive assessment of your urinary patterns.
-
Recording Instances:
- Date and Time: Each time you urinate, note down the exact date and time.
- Volume: Measure and record the urine output. This can often be done using a measuring cup or container. If unsure, a rough estimate is acceptable to provide general insights.
- Leaking Events: Document any episodes of leakage, including the time they occurred and the approximated volume.
-
Review Daily: Take a few moments at the end of each day to ensure all data is filled accurately. This is crucial for maintaining the integrity of your records.
-
Report Findings: Bring the completed chart to your healthcare provider's appointment. Discuss any patterns observed, such as increased urgency or frequency, to aid in diagnosis and treatment options.
Over time, keeping this chart can enhance your understanding of your own urinary health, allowing you to be better equipped when discussing your condition with healthcare professionals.
Steps to Complete the Urine Frequency / Volume / Leaks Chart
Completing the Urine Frequency / Volume / Leaks Chart requires attention to detail to ensure that all pertinent information is correctly recorded. Follow these steps:
-
Initial Setup:
- Obtain the chart in either printed form or digital format. Ensure clarity in the fields provided.
-
Log Urination Events:
- Each time you urinate, record the date and time of the event in the respective fields on the chart.
- Measure the volume of urine. Use a graduated measuring cup or a similar container for accuracy. For example, if the volume measures 250 ml, write this down in your chart under the appropriate time entry.
-
Documenting Leaks:
- Note any instances of involuntary leakage. Record the time of the incident and provide an approximate volume, if identifiable. For instance, you might document a leak at 3:00 PM with an estimated volume of 50 ml.
-
Regular Updates:
- Repeat this process throughout the day, ensuring you consistently update the chart after each urination event or any leakage incident.
-
Review and Reflection:
- At the end of your tracking period, review your entries. Look for patterns, such as times of day with more frequent urination or instances when leaks were more common.
-
Prepare for Evaluation:
- Bring your completed chart to your next medical appointment for discussion. It can provide critical insights into your urinary health and help your provider tailor treatment strategies effectively.
Examples of Using the Urine Frequency / Volume / Leaks Chart
The Urine Frequency / Volume / Leaks Chart can serve various contexts and needs in urine health monitoring. Here are some practical examples:
-
Post-Surgery Monitoring: A patient recovering from prostate surgery may use the chart to document changes in urination habits to inform their healthcare provider of any abnormalities during recovery.
-
Diagnosis of Overactive Bladder: Individuals experiencing sudden urges may utilize the chart to quantify their urges and leakage episodes, allowing for targeted treatment discussions with their doctors.
-
Pregnancy Tracking: Expectant mothers can monitor urinary changes as their bodies undergo hormonal and physical transformations, using the chart to help providers understand their symptoms and manage any urinary concerns.
-
Management of Chronic Conditions: Patients with diabetes or chronic kidney issues can use the chart to track changes in urination patterns over time, facilitating better management of their overall health condition and any associated urinary symptoms.
By employing the urine frequency chart effectively in these scenarios, individuals can contribute valuable information towards their healthcare management, leading to better outcomes.
Key Elements of the Urine Frequency / Volume / Leaks Chart
Understanding the key elements of the Urine Frequency / Volume / Leaks Chart is essential for effective tracking. The critical components include:
-
Date: The day of recording, allowing for trend identification over time.
-
Time of Urination: Precise timestamps of when each urination occurs provide context for frequency.
-
Urine Volume: Actual measurements help identify normal versus abnormal output, which can vary by individual needs.
-
Leaks: Instances of involuntary leakage, including the time and estimated volume, can indicate problems needing medical evaluation.
-
Daily Totals: A summary at the end of each day to aggregate total volumes passed and instances of leaks, giving a clear overview of daily patterns.
-
Comments Section: Optional area for personal observations, such as other symptoms experienced or reactions to certain foods or activities that might influence urination.
By focusing on these elements, users can maintain accurate records that are useful for healthcare assessments.
Important Terms Related to the Urine Frequency / Volume / Leaks Chart
Familiarizing yourself with specific terminology related to the Urine Frequency / Volume / Leaks Chart helps in accurately understanding and utilizing the chart effectively:
-
Micturition: The process of urinating or voiding urine.
-
Incontinence: The inability to control urination, leading to unexpected leakage.
-
Urinary Frequency: A term denoting how often a person urinates, which can be influenced by fluid intake, medications, or medical conditions.
-
Nocturia: The condition of waking during the night to urinate, which can significantly impact sleep quality and overall health.
-
Oliguria: A medical term for low urine output, often a precursor to nephrological concerns.
Understanding these terms helps patients communicate more effectively with healthcare providers and ensures clarity in documenting urinary habits.
Who Typically Uses the Urine Frequency / Volume / Leaks Chart
The Urine Frequency / Volume / Leaks Chart is used by a diverse range of individuals:
-
Patients with Urinary Disorders: Individuals diagnosed with urinary conditions, such as urinary tract infections or bladder control issues, utilize the chart to monitor their urinary habits closely.
-
Postoperative Patients: Those who have undergone surgeries related to the urinary tract, such as prostate surgery, often use the chart to track recovery progress and changes in urination.
-
Chronic Illness Sufferers: Patients with chronic conditions like diabetes or neurological disorders may keep the chart to monitor how these conditions affect their urinary patterns.
-
Pregnant Women: As pregnancy progresses, women may experience increased frequency of urination. Keeping the chart allows for awareness of any related symptoms.
-
Healthcare Providers: Medical professionals often request this chart to gain insights into patients’ urinary habits for diagnosis and treatment planning.
By understanding the demographics of users, healthcare professionals can tailor their approaches and ensure effective monitoring and management of urinary health.