



01. Edit your bitterness ratio online
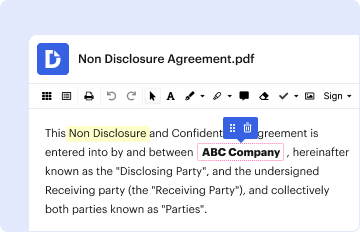
Type text, add images, blackout confidential details, add comments, highlights and more.

Type text, add images, blackout confidential details, add comments, highlights and more.
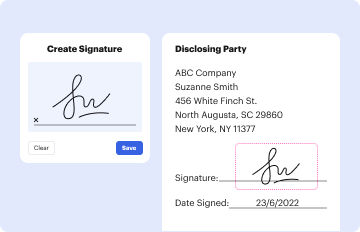
Draw your signature, type it, upload its image, or use your mobile device as a signature pad.

Send bitterness ratio by style via email, link, or fax. You can also download it, export it or print it out.
A bitterness ratio chart is a comprehensive tool that outlines various beer styles based on their bitterness levels. It categorizes beers by their original gravity (OG) and international bitterness units (IBU), offering homebrewers a guide to understanding the expected bitterness levels of different beer styles. The chart covers a wide array of beer types, including lagers, ales, IPAs, and stouts, each exhibiting unique bitterness characteristics. Equipped with minimum and maximum values for OG and IBU, brewers can accurately tailor their recipes to achieve desired flavor profiles.
To effectively use the bitterness ratio chart, begin by identifying the beer style you wish to brew. Locate this style on the chart to understand its typical OG and IBU range. These parameters are essential for achieving the desired balance between malt sweetness and hop bitterness. When formulating a recipe, adjust your grain bill and hop additions to fall within these suggested ranges. For example, if brewing an IPA with a high bitterness preference, aim for the upper end of the IBU range. The chart serves as a reference to maintain style authenticity while allowing innovation within set guidelines.
The primary users of the bitterness ratio chart are homebrewers and craft brewers. Homebrewers leverage the chart to ensure their brews align with traditional style guidelines, especially when experimenting with new recipes. Craft brewers use it to fine-tune their offerings, maintaining consistency in flagship beers while exploring new variations. Additionally, brewing educators and enthusiasts might use the chart as an educational tool to demonstrate the relationship between OG, IBU, and flavor profile in beer.


The chart highlights several key elements that are crucial for understanding beer bitterness:
Each of these elements helps brewers predict how a beer will taste and feel, assisting in the creation of balanced, enjoyable brews.
Consider a homebrewer planning to make a pale ale. By consulting the chart, they find the typical OG range is 1.045 to 1.065, with IBUs ranging from 30 to 50. Armed with this information, they can craft a balanced beer with enough bitterness to counteract the malt sweetness, achieving a harmonious final product. In another instance, a craft brewery might adjust their popular stout's recipe by slightly increasing its IBU to give it a more robust profile, guided by the chart's parameters.
Understanding the terminology in a bitterness ratio chart is vital for using it effectively:
Each term represents a critical component in beer production, shedding light on how each factor influences the final taste and quality.
While the bitterness ratio chart itself does not have direct legal connotations, professional brewers must adhere to labeling standards and consumer protection laws that dictate accurate representation of beer styles. For commercial brewers, adhering to the chart ensures their products meet consumer expectations for a given style, thus maintaining regulatory compliance and customer satisfaction.
Different states may have regulations affecting brewing processes or marketing practices. While the chart offers standardized style guidelines, brewers must adapt to local laws regarding alcohol content, labeling, and ingredient sourcing. For instance, a state might impose limits on IBU levels to classify a beer type or restrict certain brewing ingredients. Understanding and complying with these regulations is crucial for breweries to avoid legal complications and operate successfully within the law.
We've got more versions of the bitterness ratio form. Select the right bitterness ratio version from the list and start editing it straight away!
| Versions | Form popularity | Fillable & printable |
|---|---|---|
| 2013 | 4.3 Satisfied (59 Votes) |
At DocHub, your data security is our priority. We follow HIPAA, SOC2, GDPR, and other standards, so you can work on your documents with confidence.
by ME Batali 2020 Cited by 59 The chart is divided into 9 regions, with vertical demarcations versus TDS labelled as strong or weak and horizontal demarcations versus PERead more
by VA Algazzali 2014 Cited by 105 Humulinones were found to be on average 66% as bitter as iso--acid (+/-13%) and hulupones 84% as bitter as iso--acids (+/-10%).


