Definition and Meaning
Flip charts are essential visual aids commonly used in business meetings, educational settings, and workshops to display ideas and information in a clear and dynamic manner. They typically consist of large paper pads attached to an easel. This traditional tool allows presenters to illustrate concepts visually, making it easier for audiences to grasp complex topics. Flip charts are favored for their simplicity, portability, and ability to engage participants in interactive discussions.
How to Use Flip Charts
When using flip charts, the goal is to communicate effectively and foster engagement. Here's a step-by-step guide:
-
Preparation: Before your presentation, prepare your content. Use bold markers and large, legible lettering. Pre-draw graphics or headings on a few sheets to streamline your presentation.
-
Organization: Arrange your sheets in a logical sequence. Consider the flow of information and how each point builds upon the last. Number each sheet in advance for quick reference.
-
Presentation: During your presentation, stand to the side of the flip chart so you're not obstructing the view. Turn pages smoothly to maintain your audience's focus.
-
Interaction: Involve the audience by asking for input and using their responses to fill in blank areas or add notes. This encourages participation and makes the session more dynamic.
-
Preservation: After the session, if needed, take photos of the completed pages for archiving or to share with attendees.
Key Elements of the Flip Charts
Effective flip charts share several vital elements:
- Clarity: Use clear, simple language and avoid overloading a single page with too much information.
- Visual Appeal: Include graphs, diagrams, and drawings to make information more accessible. Use contrasting colors for emphasis.
- Interactivity: Leave space for audience additions or notes, fostering a collaborative environment.
- Sequential Flow: Ensure the pages follow a logical progression, guiding viewers through the material seamlessly.
Steps to Complete Flip Charts
Follow these steps to complete a flip chart from start to finish:
-
Content Creation: Draft the information you'll present, breaking it down into digestible sections.
-
Material Gathering: Collect necessary materials such as pens, markers, and additional paper for brainstorming.
-
Design Layout: Outline the structure of each page, keeping in mind how each will transition to the next.
-
Execution: Transfer the content onto the flip chart, using your pre-designed layout.
-
Review: Go through each page to ensure content accuracy and clarity.
-
Rehearse: Practice your delivery with the flip chart to identify any potential challenges.
Examples of Using Flip Charts
Flip charts can be effectively used in a multitude of scenarios:
- Business Meetings: Illustrating project timelines and strategic plans.
- Educational Settings: Summarizing key points in a lecture or displaying complex formulas.
- Workshops: Facilitating group activities and capturing feedback or suggestions.
In these settings, flip charts become a central tool for discussions, enabling participants to follow along and contribute meaningfully.
Who Typically Uses Flip Charts
Flip charts are versatile tools used by a wide array of professionals:
- Educators use them in classrooms to simplify concepts and highlight key information.
- Business Professionals employ them during meetings to outline agendas and project updates.
- Facilitators and Trainers utilize flip charts in workshops for interactive engagement and group activities.
These users value flip charts for their tangibility and ease of use, making complex information accessible.
Digital vs. Paper Version
The choice between digital and paper flip charts depends on context and preferences:
- Paper Flip Charts: These are tactile and easy to set up anywhere, requiring no technical setup. They are ideal for face-to-face interactions and hands-on activities where technology might be distracting.
- Digital Flip Charts: Offer enhanced flexibility, allowing real-time collaboration and editing. They are useful in virtual meetings and remote collaborations, enabling seamless sharing and updating.
Each format has its strengths, and choosing the right one can significantly impact the effectiveness of your presentation.
Software Compatibility
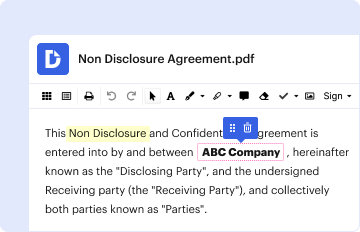
While flip charts are predominantly physical tools, their role in documentation means software still plays a crucial part. Documents related to flip charts, such as session summaries or photos of completed charts, can be processed with document management software like DocHub. This ensures that information from these sessions is archived effectively, shared quickly, and remains accessible in digital formats. Users can incorporate data from flip charts into comprehensive reports using compatible applications like Google Workspace or Microsoft Office.
State-by-State Differences
While flip charts themselves do not inherently vary by state, it’s essential to recognize that applications or content conveyed through flip charts might be subject to regional regulations or educational guidelines. For example, certain states might emphasize specific curriculum content that educators must comply with, influencing how flip charts are used in those settings. Business presentations may also reflect state-specific economic data or regulations, requiring presenters to adapt their flip charts accordingly to remain relevant and compliant.