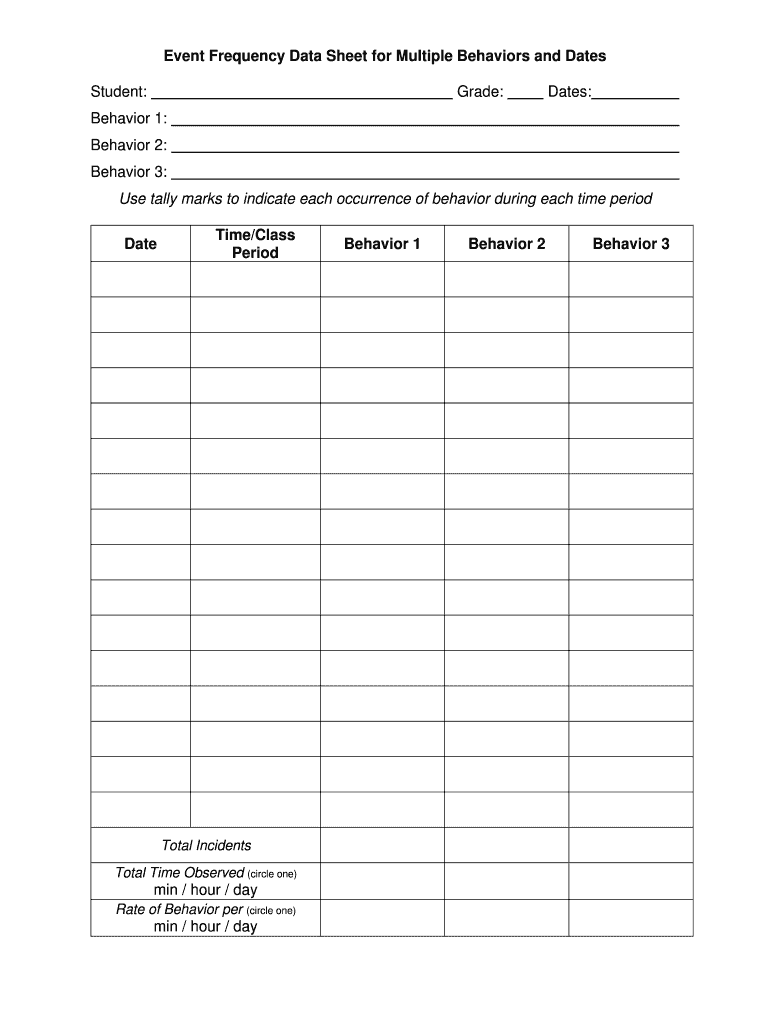


Understanding the Frequency Data Sheet
A frequency data sheet is a valuable tool used for systematically recording and analyzing the occurrence of specific behaviors or events over designated time intervals. This document is often utilized in educational, clinical, and organizational settings to track behaviors, assess trends, and evaluate interventions. By collecting frequency data, individuals and organizations can make data-driven decisions aimed at improving outcomes.
Key Components of a Frequency Data Sheet
A comprehensive frequency data sheet typically includes various sections designed to capture essential information related to behavior tracking. These components may vary based on the specific use case but generally include the following:
- Date and Time: Essential for recording when each occurrence happens.
- Observed Behavior: A clear definition of what behavior is being tracked.
- Tally Marks or Count: A method for recording how many times the behavior occurred within a designated time period.
- Total Count: A calculated sum of occurrences over the specified intervals.
- Observational Notes: Additional information or context that may influence the data collected.
Each of these sections is crucial for providing a clear picture of the behaviors or occurrences being monitored.
Steps to Complete the Frequency Data Sheet
- Prepare the Sheet: Ensure that the frequency data sheet is printed or available digitally. Label sections appropriately, including dates, observed behaviors, and tally marks.
- Define the Behavior: Clearly outline what specific behaviors will be tracked to avoid ambiguity during data collection.
- Collect Data: During the designated observation periods, record occurrences by marking tally marks in the appropriate columns. Ensure accurate and honest reporting.
- Calculate Totals: At the end of the observation period, sum the tally marks to provide a total count for each behavior.
- Review and Analyze: Assess the data collected to identify patterns, trends, or significant occurrences that may warrant further investigation or action.
These steps can be adjusted depending on the specific requirements of the organization or the objectives of the data collection.
Applications of the Frequency Data Sheet
Frequency data sheets are versatile and can be applied in various contexts, including:
- Education: Teachers may use these sheets to track student behaviors, such as participation or disruptions, aiming to identify trends and tailor interventions.
- Healthcare: Clinicians might utilize frequency data sheets to document patient behaviors, adhering to treatment protocols or noting compliance levels.
- Behavioral Analysis: Applied Behavior Analysis (ABA) practitioners often employ frequency data sheets to measure the effectiveness of interventions targeting behavioral changes in clients.
These examples illustrate the practical utility of frequency data sheets across different sectors.
Obtaining a Frequency Data Sheet
Frequency data sheets can be readily acquired through various channels:
- Templates Online: Many educational and healthcare websites offer downloadable frequency data sheet templates in formats such as PDF or Word.
- Custom Creation: Users can also create their own customized sheets using spreadsheet software, adjusting fields to meet specific tracking needs.
- Professional Resources: Some professional organizations provide frequency data sheets as part of their training materials or educational resources.
Accessing these sheets ensures that users can adequately track behaviors in their respective fields.
Who Uses a Frequency Data Sheet?
A diverse array of professionals and organizations utilize frequency data sheets, including:
- Teachers and Educators: To monitor student behavior in classroom settings.
- Therapists and Counselors: To observe client behaviors during sessions.
- Organizational Leaders: To assess employee engagement or productivity levels.
- Researchers: For collecting data in studies related to human behavior.
The adaptability of the frequency data sheet makes it an essential tool across numerous disciplines.
Important Terms Related to Frequency Data Sheet
- Frequency: The number of occurrences of a specified behavior within a given time frame.
- Tally: A method for counting occurrences, typically represented by marks made on the sheet.
- Behavior Analysis: The scientific study of behavior, often using data sheets to evaluate interventions.
- Data Collection: The systematic gathering of information for analysis.
Understanding these terms is vital for efficient use and discussion regarding frequency data sheets.
Legal Uses of Frequency Data Sheets
In certain contexts, such as educational or healthcare settings, frequency data sheets may have legal implications. Comprehensive documentation can:
- Provide evidence of behavioral trends or responses to interventions.
- Support compliance with educational regulations and standards.
- Serve as part of the assessment process for Individualized Education Programs (IEPs) in schools.
It is essential for users to understand the legal significance of their data collection practices to safeguard their interests and uphold ethical standards.