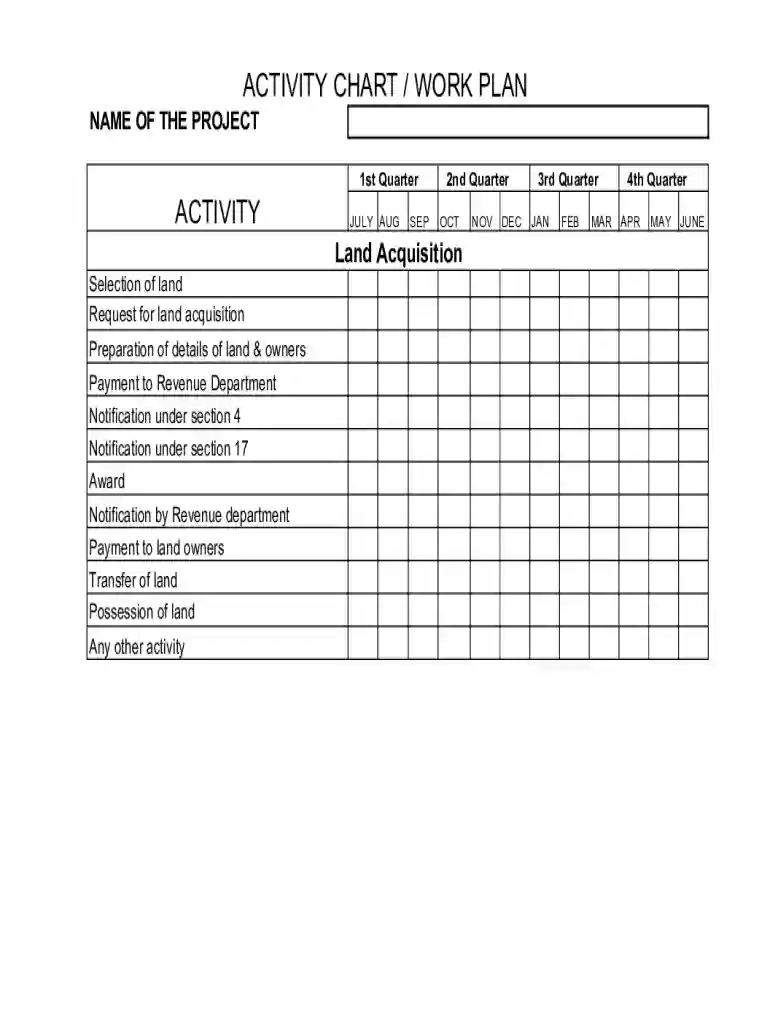
Activity Chart xls Preview on Page 1

Activity Chart xls 2026

Here's how it works

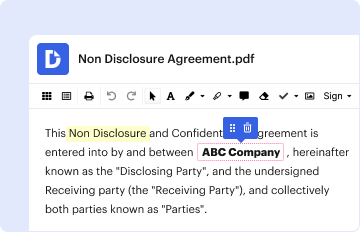
  • 01. Edit your form online

    Type text, add images, blackout confidential details, add comments, highlights and more.

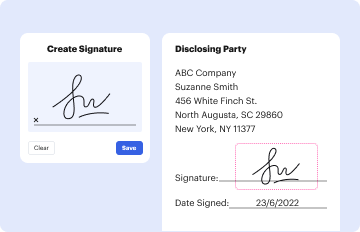
  • 02. Sign it in a few clicks

    Draw your signature, type it, upload its image, or use your mobile device as a signature pad.
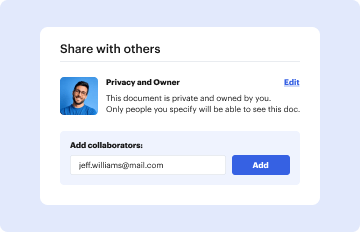
  • 03. Share your form with others

    Send it via email, link, or fax. You can also download it, export it or print it out.

How to use or fill out Activity Chart xls with our platform

Form edit decoration
9.5
Ease of Setup
DocHub User Ratings on G2
9.0
Ease of Use
DocHub User Ratings on G2
  1. Click ‘Get Form’ to open the Activity Chart xls in the editor.
  2. Begin by entering the 'Name of the Project' at the top of the form. This identifies your specific project and sets the context for all activities listed.
  3. Proceed to fill out each activity section according to the designated quarters. For example, under '1st Quarter', input activities planned for July, August, and September.
  4. For each activity, ensure you detail every task involved, such as 'Land Acquisition' or 'Recruitment'. Use clear descriptions for each step to maintain clarity.
  5. Continue filling out subsequent quarters (2nd, 3rd, and 4th) in a similar manner, ensuring all activities are accounted for across months.
  6. Review your entries for accuracy and completeness before saving or sharing your completed chart.

Start using our platform today to streamline your document editing and form completion process!

See more Activity Chart xls versions

We've got more versions of the Activity Chart xls form. Select the right Activity Chart xls version from the list and start editing it straight away!

VersionsForm popularityFillable & printable
20054.8 Satisfied (40 Votes)

be ready to get more

Complete this form in 5 minutes or less

Got questions?

We have answers to the most popular questions from our customers. If you can't find an answer to your question, please contact us.

To create a Gantt chart like the one in our example that shows task progress in days: Select the data you want to chart. Select Insert Recommended Charts Stacked Bar chart. Next, format the stacked bar chart to appear like a Gantt chart. If you dont need the legend or chart title, click it and press delete.
In the Review tab, select Show Changes. Changes are shown in the pane with the most recent changes on top, in the order the changes were made.
Select the range of cells containing the data you wish to visualize. Navigate to the Insert tab on the ribbon. Navigate to Charts and select the chart type that best suits your needs. Note: Try Recommended Charts to see suggestions based on your data.
Tracking daily and monthly tasks in Excel Click Insert Sheet Blank Sheet to add a new worksheet. Then give each row and column a header label, and use the formatting tools to design your own daily or monthly task tracker.

Security and compliance

At DocHub, your data security is our priority. We follow HIPAA, SOC2, GDPR, and other standards, so you can work on your documents with confidence.

Related links

Creating Graphs

You will become acquainted with Excel chart making tools and make appropriately labeled Pie Charts, Bar Charts and XY scatterplots.

Learn more
mini-lesson-scholarships-activity-chart-

Aug 18, 2023 The Activity Chart worksheet can be used to help students apply for scholarships or complete applications for college, technical schools, orRead more

Learn more
Permanganate

This Excel workbook contains an annotated bibliography summarizing a number of studies. Each is represented by a separate worksheet in this Excel file. Has

Learn more
If you believe that this page should be taken down, please follow our DMCA take down process here