


Definition and Importance of Motion Graphs
Motion graphs are critical tools in physics that visually represent the relationship between an object's position, velocity, and acceleration over time. The interpreting motion graphs worksheet pdf focuses on various types of motion graphs, such as position-time, velocity-time, and acceleration-time graphs. Understanding these graphs is crucial for students as they provide a framework for analyzing real-world motion scenarios.
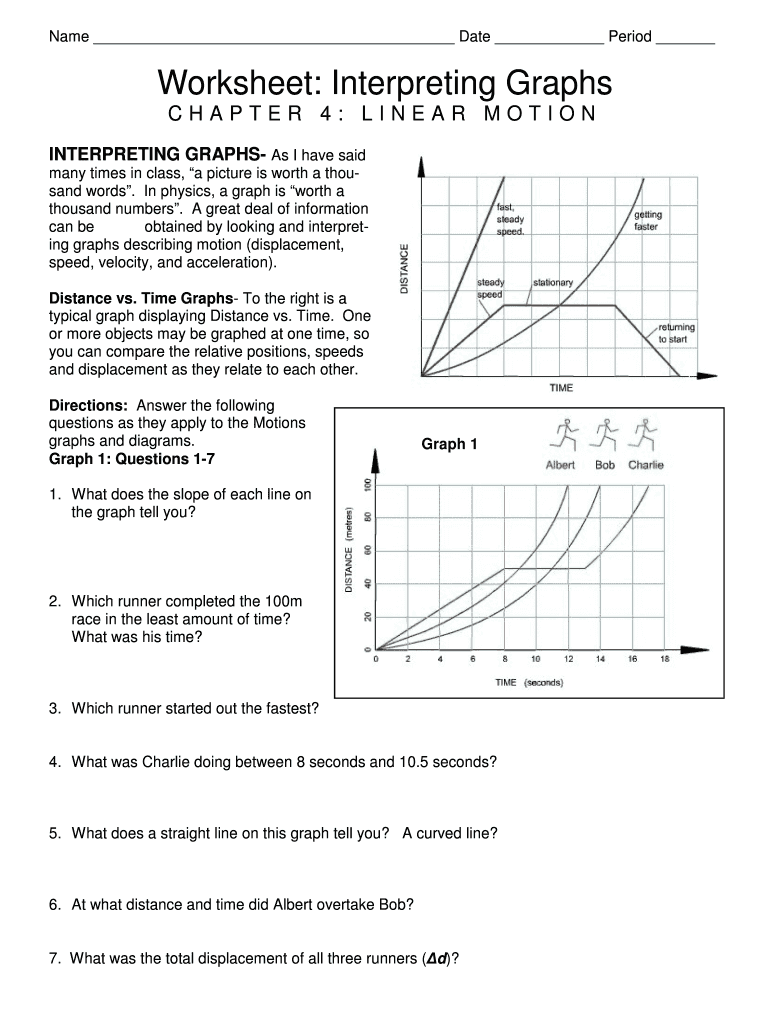
- Position-Time Graphs: These graphs display an object's location as a function of time. The slope of the line indicates the object's speed, while a horizontal line signifies the object is at rest.
- Velocity-Time Graphs: This type showcases how an object's velocity changes over time. The area under the curve represents the distance traveled.
- Acceleration-Time Graphs: Such graphs depict changes in acceleration, helping students understand concepts like uniform acceleration and free fall.
By utilizing a worksheet dedicated to interpreting these graphs, students can enhance their analytical skills, laying a strong foundation for understanding kinematics and dynamics.
How to Effectively Use the Interpreting Motion Graphs Worksheet PDF
Utilizing the interpreting motion graphs worksheet pdf involves several steps. The process serves both as a practice tool and an assessment resource for students learning physics.
- Download the Worksheet: Obtain the worksheet via educational resources or platforms that provide physics worksheets in PDF format for easier access and printing.
- Read Instructions Carefully: Each section of the worksheet will typically include clear directions. Make sure to understand what is being asked before attempting to answer.
- Analyze Graphs Thoroughly: For each graph, focus on identifying key features such as slopes, sections of constancy, and areas that indicate acceleration or deceleration.
- Answer the Questions: Use specific examples from the graphs, like calculating the slope for speed or interpreting sections as segments of constant velocity or acceleration.
- Review Answers with Key: After completing the questions, refer to the motion graph worksheet answer key to evaluate your responses and understand any mistakes.
This structured approach ensures that students not only complete the worksheet but also grasp the underlying concepts of motion graphs.
How to Obtain the Interpreting Motion Graphs Worksheet PDF
Acquiring the interpreting motion graphs worksheet pdf is straightforward. Here's how you can easily access it:
- Educational Websites: Many educational resources and teacher sites provide downloadable worksheets focusing on motion graphs. Search specifically for "interpreting motion graphs worksheet pdf."
- Online Forums: Physics discussion forums and academic platforms often share resources. Users trade and recommend study aids relevant to kinematics.
- School Resources: Teachers might provide the worksheet directly through class materials, often available through learning management systems (LMS) like Google Classroom or Canvas.
- Custom Creation: If pre-made worksheets do not meet your needs, consider designing your own using graphing software or educational tools that allow you to create custom graphs with corresponding questions.
Ensuring access to varied sources enriches the learning experience by exposing students to different types of scenarios found in motion graph analysis.
Steps to Complete the Interpreting Motion Graphs Worksheet PDF
Completing the interpreting motion graphs worksheet involves a systematic approach. The following steps outline an effective process:
- Gather Materials: Have the worksheet, a calculator, and writing instruments ready for notation.
- Initial Review: Skim through the entire worksheet. Familiarize yourself with the different types of graphs included and the questions that follow.
- Detailed Analysis:
- For each graph, identify the axes and units provided. Understanding what each axis represents is crucial.
- Determine the slope by using the formula (change in y/change in x), which indicates speed or acceleration.
- Answer Questions: Tackle each question methodically, supporting your responses with detailed explanations derived from the graphs.
- Cross-Check: Verify your responses by reviewing the accompanying worksheets with answers to ensure understanding and accuracy.
Following these steps enhances comprehension and strengthens analytical skills essential for physics.
Real-World Applications of Motion Graphs
The concepts presented in the interpreting motion graphs worksheet pdf have significant real-world applications, demonstrating the practical importance of understanding motion graphs in everyday life:
- Transportation: Engineers use motion graphs to illustrate vehicle speed and fuel efficiency over different terrains. This analysis assists in designing better vehicles and routes.
- Sports Science: Coaches utilize motion graphs to assess and improve athlete performance by analyzing their speed and acceleration during training sessions.
- Physics Research: Researchers studying motion phenomena, like projectile motion or the effects of gravity on varying objects, rely on these graphs to present data effectively.
- Education: Teachers leverage these worksheets to reinforce lessons, making abstract concepts more tangible by linking them to relatable scenarios.
These real-world connections reinforce the importance of mastering the interpreting motion graphs worksheet pdf for a broader understanding of not just physics but also applied sciences.
Key Terminology Related to Interpreting Motion Graphs
Understanding the language of motion graphs is essential for effectively interpreting the interpreting motion graphs worksheet pdf. Here are several critical terms:
- Displacement: The overall change in position of an object; essential for understanding position-time graphs.
- Velocity: The speed of an object in a given direction; key to interpreting velocity-time graphs.
- Acceleration: The rate at which velocity changes; vital for acceleration-time graphs.
- Slope: The steepness of a graph line, which indicates speed or acceleration; understanding slope is crucial for analysis.
Familiarity with these terms enhances the ability to engage with the worksheet effectively, leading to deeper comprehension of motion-related concepts.