Create your Horizontal analysis of Balance Sheet Template from scratch

Start Building Now
Title decoration

Here's how it works

01. Start with a blank Horizontal analysis of Balance Sheet Template
Open the blank document in the editor, set the document view, and add extra pages if applicable.
02. Add and configure fillable fields
Use the top toolbar to insert fields like text and signature boxes, radio buttons, checkboxes, and more. Assign users to fields.
03. Distribute your form
Share your Horizontal analysis of Balance Sheet Template in seconds via email or a link. You can also download it, export it, or print it out.

A brief guide on how to create a polished Horizontal analysis of Balance Sheet Template

Form edit decoration

Step 1: Sign in to DocHub to create your Horizontal analysis of Balance Sheet Template.

First, log in to your DocHub account. If you don't have one, you can easily register for free.

Step 2: Go to the dashboard.

Once you’re in, navigate to your dashboard. This is your main hub for all document-related operations.

Step 3: Initiate new document creation.

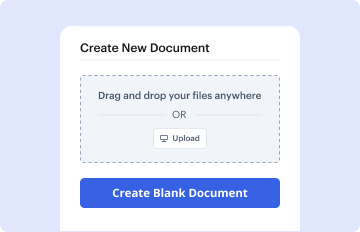
In your dashboard, choose New Document in the upper left corner. Choose Create Blank Document to design the Horizontal analysis of Balance Sheet Template from the ground up.

Step 4: Add template elements.

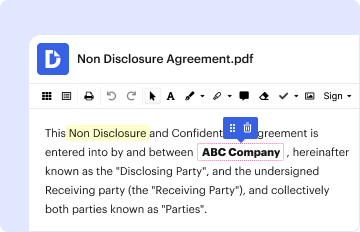
Place numerous elements like text boxes, images, signature fields, and other fields to your template and assign these fields to intended users as needed.

Step 5: Configure your document.

Personalize your form by adding directions or any other essential tips utilizing the text option.

Step 6: Double-check and modify the document.

Carefully examine your created Horizontal analysis of Balance Sheet Template for any errors or needed adjustments. Leverage DocHub's editing features to perfect your document.

Step 7: Share or export the document.

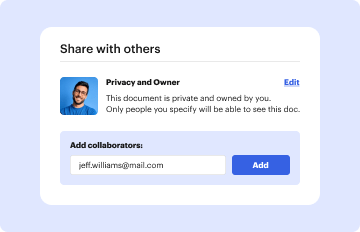
After finalizing, save your copy. You can select to keep it within DocHub, export it to various storage options, or send it via a link or email.

be ready to get more

Build your Horizontal analysis of Balance Sheet Template in minutes

Start creating now

Got questions?

We have answers to the most popular questions from our customers. If you can't find an answer to your question, please contact us.
Contact us
Horizontal Analysis of Balance Sheets Select the Time Period. For this example, the analysis will be carried out on the data reported for 2021 and 2022. Gather Data. I can find the data I want to analyze for 2021 and 2022 at the top of the balance sheet: Current Assets. Calculate % Change. Analyze Compare Results.
How to Create a Profit and Loss Statement in Excel Download, Open, and Save the Excel Template. Input Your Company and Statement Dates. Calculate Gross Profit. Input Sales Revenue to Calculate Gross Revenue. Input the Cost of Goods Sold (COGS) Calculate the Net Income. Input Your Business Expenses.
If you open up Excel and then use the relevant keyword in the Search All Templates box, you should be able to find a basic template that will fit your needs. For example, Excel has an inbuilt profit and loss statement template, business expenses budget template, budget planner template, and more.
You can use pre-built Excel templates for time management, budgeting, project planning, and much more.
Formula Horizontal Analysis (absolute) = Amount in Comparison Year Amount in Base Year. Horizontal Analysis (%) = [(Amount in Comparison Year Amount in Base Year) / Amount in Base Year] * 100. Horizontal Analysis (absolute) = Amount in Comparison Year Amount in Base Year.
be ready to get more

Build your Horizontal analysis of Balance Sheet Template in minutes

Start creating now

Related Q&A to Horizontal analysis of Balance Sheet Template

Open a new Excel spreadsheet and label the columns and rows. In the first column, label the rows with Assets, Liabilities, and Equity. This creates the main sections of the balance sheet. Arrange the assets above liabilities and equity to maintain a standard format.
For example, if a companys current year (2022) revenue is $50 million in 2022 and its revenue in the base period, 2021, was $40 million, the net difference between the two periods is $10 million. By dividing the net difference by the base figure, the percentage change comes out to 25%.
The Excel Balance Sheet Template easily integrates with Microsoft Office Suite, enabling you to import/export data effortlessly and collaborate with colleagues using familiar tools. You can also use Excels advanced analysis features, such as pivot tables and charts, to gain deeper insights into your financial data.

Additional resources on building your forms