Create your Horizontal analysis Balance Sheet Template from scratch

Start Building Now
Title decoration

Here's how it works

01. Start with a blank Horizontal analysis Balance Sheet Template
Open the blank document in the editor, set the document view, and add extra pages if applicable.
02. Add and configure fillable fields
Use the top toolbar to insert fields like text and signature boxes, radio buttons, checkboxes, and more. Assign users to fields.
03. Distribute your form
Share your Horizontal analysis Balance Sheet Template in seconds via email or a link. You can also download it, export it, or print it out.

Build Horizontal analysis Balance Sheet Template from the ground up with these comprehensive instructions

Form edit decoration

Step 1: Start off by launching DocHub.

Begin by setting up a free DocHub account using any available sign-up method. If you already have one, simply log in.

Step 2: Sign up for a 30-day free trial.

Try out the whole suite of DocHub's pro features by signing up for a free 30-day trial of the Pro plan and proceed to build your Horizontal analysis Balance Sheet Template.

Step 3: Start with a new empty document.

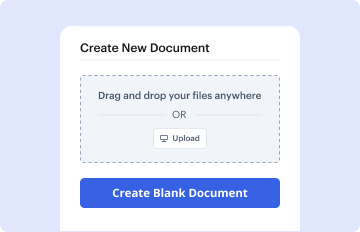
In your dashboard, click the New Document button > scroll down and hit Create Blank Document. You’ll be redirected to the editor.

Step 4: Arrange the view of the document.

Utilize the Page Controls icon marked by the arrow to switch between two page views and layouts for more convenience.

Step 5: Begin by adding fields to design the dynamic Horizontal analysis Balance Sheet Template.

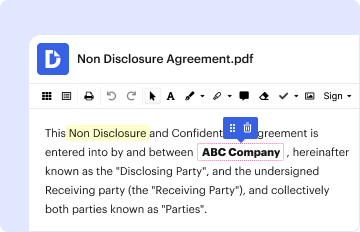
Explore the top toolbar to add document fields. Add and format text boxes, the signature block (if applicable), embed images, etc.

Step 6: Prepare and configure the incorporated fields.

Configure the fields you incorporated based on your chosen layout. Personalize the size, font, and alignment to make sure the form is user-friendly and professional.

Step 7: Finalize and share your document.

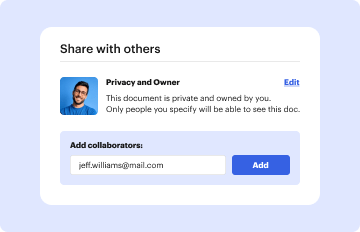
Save the ready-to-go copy in DocHub or in platforms like Google Drive or Dropbox, or create a new Horizontal analysis Balance Sheet Template. Send out your form via email or use a public link to engage with more people.

be ready to get more

Build your Horizontal analysis Balance Sheet Template in minutes

Start creating now

Got questions?

We have answers to the most popular questions from our customers. If you can't find an answer to your question, please contact us.
Contact us
For example, if a companys current year (2022) revenue is $50 million in 2022 and its revenue in the base period, 2021, was $40 million, the net difference between the two periods is $10 million. By dividing the net difference by the base figure, the percentage change comes out to 25%.
Horizontal Analysis: Involves percentage changes or absolute variances between corresponding line items across years. Vertical Analysis: Represents each line item as a percentage of a base figure, offering insights into the proportional contribution of each element.
The most common types of financial analysis are: Vertical. Horizontal. Leverage. Growth. Profitability. Liquidity. Efficiency. Cash Flow.
Formula Horizontal Analysis (absolute) = Amount in Comparison Year Amount in Base Year. Horizontal Analysis (%) = [(Amount in Comparison Year Amount in Base Year) / Amount in Base Year] * 100. Horizontal Analysis (absolute) = Amount in Comparison Year Amount in Base Year.
Horizontal Analysis of Balance Sheets Select the Time Period. For this example, the analysis will be carried out on the data reported for 2021 and 2022. Gather Data. I can find the data I want to analyze for 2021 and 2022 at the top of the balance sheet: Current Assets. Calculate % Change. Analyze Compare Results.
be ready to get more

Build your Horizontal analysis Balance Sheet Template in minutes

Start creating now

Related Q&A to Horizontal analysis Balance Sheet Template

The Excel Balance Sheet Template easily integrates with Microsoft Office Suite, enabling you to import/export data effortlessly and collaborate with colleagues using familiar tools. You can also use Excels advanced analysis features, such as pivot tables and charts, to gain deeper insights into your financial data.
Comparative financial statements place two years (or more) of the same statement side by side. A horizontal analysis involves noting the increases and decreases both in the amount and in the percentage of each line item.

Additional resources on building your forms