Create your Graphical Abstract Template from scratch

Start Building Now
Title decoration

Here's how it works

01. Start with a blank Graphical Abstract Template
Open the blank document in the editor, set the document view, and add extra pages if applicable.
02. Add and configure fillable fields
Use the top toolbar to insert fields like text and signature boxes, radio buttons, checkboxes, and more. Assign users to fields.
03. Distribute your form
Share your Graphical Abstract Template in seconds via email or a link. You can also download it, export it, or print it out.

Build Graphical Abstract Template from scratch by following these comprehensive instructions

Form edit decoration

Step 1: Open DocHub and get going.

Start by creating a free DocHub account using any offered sign-up method. Simply log in if you already have one.

Step 2: Sign up for a 30-day free trial.

Try out the complete set of DocHub's advanced features by registering for a free 30-day trial of the Pro plan and proceed to build your Graphical Abstract Template.

Step 3: Create a new blank form.

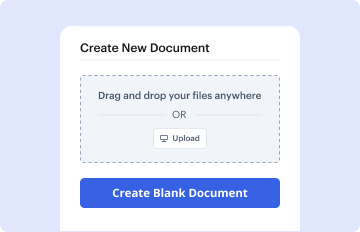
In your dashboard, choose the New Document button > scroll down and hit Create Blank Document. You’ll be taken to the editor.

Step 4: Organize the document’s layout.

Use the Page Controls icon indicated by the arrow to switch between two page views and layouts for more flexibility.

Step 5: Start adding fields to create the dynamic Graphical Abstract Template.

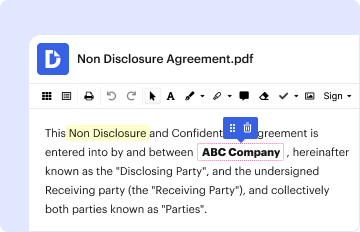
Navigate through the top toolbar to add document fields. Add and format text boxes, the signature block (if applicable), insert images, etc.

Step 6: Prepare and customize the added fields.

Configure the fillable areas you added based on your preferred layout. Modify the size, font, and alignment to ensure the form is straightforward and polished.

Step 7: Finalize and share your document.

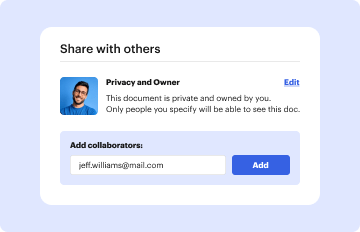
Save the ready-to-go copy in DocHub or in platforms like Google Drive or Dropbox, or craft a new Graphical Abstract Template. Send out your form via email or get a public link to reach more people.

be ready to get more

Build your Graphical Abstract Template in minutes

Start creating now

Got questions?

We have answers to the most popular questions from our customers. If you can't find an answer to your question, please contact us.
Contact us
Five tips for creating an effective graphical abstract Focus on key messages. Research is exciting, and it is natural to want to include all the findings of your study. Focus on visual elements. Keep it simple! Maintain consistency. Adhere to journal guidelines.
Some popular options include docHub Illustrator, Canva, Inkscape, GIMP, and Microsoft PowerPoint. docHub Illustrator is a powerful vector graphics editor that is widely used in the scientific community. Canva is a user-friendly design tool that is well-suited for creating simple graphical abstracts.
How to create your Graphical Abstract in 3 steps Select a template. Select from 300+ Customize any element. Easily select and manage illustrations, text, shapes, colors, and all other elements on your template. Download and Share.
How to Create a Visual Abstract in 5 Easy Steps Find the main takeaways or points your audience would want to know. Use a templates to create your design. Find icons to replace chunks of words that represent the essence of those words. Post where your audience spends their time.
docHub Illustrator This tool allows for full customization of graphical abstracts by creating high resolution vector designs where every pixel can be adjusted to make the perfect final design. Learn more about how to get docHub Illustrator as a student or scientist.
be ready to get more

Build your Graphical Abstract Template in minutes

Start creating now

Related Q&A to Graphical Abstract Template

How to Make an Effective Graphical Abstract Write your abstract after finishing writing your paper. Write 1-2 sentences each for Introduction, Hypothesis, Methods, Results and Conclusion. Pick out key graphs/images from the paper to use in a graphical abstract. Imagine what images could be used to make it stand out?
A graphical abstract is used to present the conclusions and most important findings of a research. While an infographic is intended to give a larger narrative, it is also intended to visually tell a story about the data.

Additional resources on building your forms